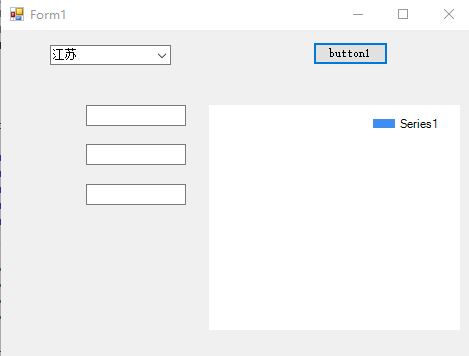
series位置调节代码没用,且在combox处每重选一次直辖市,图就多一个标题,如何使它重选时不会多出现
`` private void button1_Click(object sender, EventArgs e)
{
flag = true;
}
private void Form1_Load(object sender, EventArgs e)
{
string dbPath = @"D:\历年高考分数.db";
string sq = @"Data Source=" + dbPath;
m = new SQLiteConnection(sq);
m.Open();
SQLiteDataAdapter mAdapter = new SQLiteDataAdapter("select province from combox1值", m);
DataSet ds = new DataSet();
mAdapter.Fill(ds);
DataTable dt = ds.Tables[0];
comboBox1.DataSource = dt;
comboBox1.ValueMember = "province";
//comboBox1.SelectedIndex = 0;
m.Close();
}
    private void comboBox1_SelectedValueChanged(object sender, EventArgs e)
    {

       if (comboBox1.Text == "四川")
        {
            if (flag == true)//如果按钮被点击
            {
                textBox1.Text="我";
            }

        }
       else if (comboBox1.Text == "江苏")
        {
            if (flag == true)//如果按钮被点击
            {
                textBox2.Text = "你";
            }
        }
        else if (comboBox1.Text =="广州")
        {
            if (flag == true)//如果按钮被点击
            {
                textBox3.Text = "他";
            }
        }
       else if (comboBox1.Text == "直辖市")
        {
            if (flag == true)//如果按钮被点击
            {
                Creatchart4();
            }

        }
    }
private void Creatchart4()
{
string dbPath = @"D:\历年高考分数.db";
string sq = @"Data Source=" + dbPath;
m = new SQLiteConnection(sq);
m.Open();
SQLiteDataAdapter mAdapter = new SQLiteDataAdapter("select para,Volume1, Volume2 from 电缆参数", m);
DataSet ds = new DataSet();
mAdapter.Fill(ds);
DataTable dt = ds.Tables[0];
//设置图表的数据源
chart2.DataSource = dt;
chart2.Series.Clear();
Legend leg = new Legend();
leg.Docking = Docking.Top;//设置停靠在图表区域的位置
Series s1 = new Series();
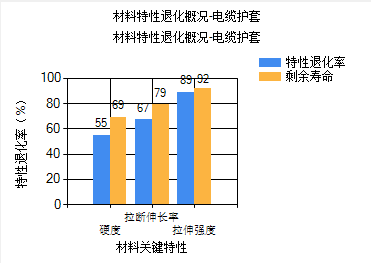
s1.LegendText = "特性退化率";
s1.IsValueShownAsLabel = true;
chart2.Series.Add(s1);
Series s2 = new Series();
s2.LegendText = "剩余寿命";
s2.IsValueShownAsLabel = true;
chart2.Series.Add(s2);
chart2.Legends.Add(leg);
chart2.ChartAreas[0].AxisX.Title = "材料关键特性";
chart2.ChartAreas[0].AxisY.Title = "特性退化率(%)";
chart2.Titles.Add("材料特性退化概况-电缆护套");
//chart2.Width = 260;
//chart2.Height = 260;
//设置图表Y轴对应项
chart2.Series[0].YValueMembers = "Volume1";
chart2.Series[1].YValueMembers = "Volume2";
//设置图表X轴对应项
chart2.Series[0].XValueMember = "para";
//绑定数据
chart2.DataBind();
m.Close();
}
根据你提供的代码,多个标题的问题可能是因为每次选择直辖市时都会调用CreateChart4()函数,但是在函数中并没有对chart2.Series进行Clear操作。导致每次选择直辖市时会新建一个Series,而不是更新原有的Series。因此,你可以在CreateChart4()函数中添加以下代码:
chart2.Series.Clear();//清空原有的Series
这样就可以每次选择直辖市时更新原有的Series了。