微信小程序 echarts 雷达图 如何实现点击事件(六边形数字项)跳转页面功能,可付费咨询
因为在选项卡下面做的雷达图,可能结构有点复杂,之前试的方法都提示,chart undefined,希望大佬用我这个代码试一下,非常感谢
1)实现单击雷达图 六边形顶点数字 可跳转一个页面 功能
2)双击六边形顶点数字 可跳转另一个页面 功能
3)单击小圆点 显示的具体数值 跳转第三个页面 功能
```javascript
import * as echarts from '../../ec-canvas/echarts';
function initChart(canvas, width, height, dpr) {
console.log(canvas, width, height, dpr);
const chart = echarts.init(canvas, null, {
width: width,
height: height,
devicePixelRatio: dpr // new/
});
canvas.setChart(chart);
chart.setOption(getChartOption(canvas.canvasId));
return chart;
}
function getChartOption(canvasId) {
var option = {
backgroundColor: "#ffffff",
xAxis: {
show: false
},
yAxis: {
show: false
},
radar: {
// shape: 'circle',
indicator: [{
name: '1',
max: 500
},
{
name: '2',
max: 500
},
{
name: '3',
max: 500
},
{
name: '4',
max: 500
},
{
name: '5',
max: 500
},
{
name: '6',
max: 500
}
]
},
series: [{
type: 'radar',
data: [{
value: getChartOptionDetail(canvasId),
areaStyle: { // 单项区域填充样式
normal: {
color: 'rgba(88, 153, 238, 0.247)' // 填充的颜色。[ default: "#000" ]
}
},
label: {
normal: {
show: true,
formatter:function(params) {
return params.value;
}
}
}
}
]
}]
};
return option;
}
function getChartOptionDetail(canvasId){
switch(canvasId){
case "radar1-graph":
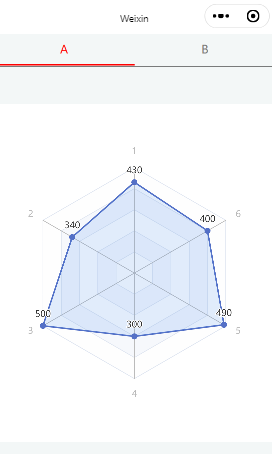
return [430, 340, 500, 300, 490, 400, 500, 300, 490, 400];
case "radar2-graph":
return [230, 440, 230, 230, 413, 300, 230, 120, 90, 40];
default:
return [430, 340, 500, 300, 490, 400, 500, 300, 490, 400];
}
}
Page({
/**
* 页面的初始数据
*/
data: {
winWidth:0,
winHeight:0,
currentTab:0,
ec1: {
onInit: initChart
},
ec2: {
onInit: initChart
}
},
onLoad: function (options) {
},
/**
* 生命周期函数--监听页面加载
*/
onLoad: function (options) {
var that = this;
/**
* 获取系统信息
*/
wx.getSystemInfo({
success: function (res) {
that.setData({
winWidth: res.windowWidth,
winHeight: res.windowHeight
});
}
});
},
onReady: function () {
},
bindChange: function (e) {
var that = this;
that.setData({ currentTab: e.detail.current });
},
swichNav: function (e) {
var that = this;
if (this.data.currentTab === e.target.dataset.current) {
return false;
} else {
that.setData({
currentTab: e.target.dataset.current
})
}
}
})
```xml


<view class="swiper-tab">
<view class="tab-item {{currentTab==0 ? 'on' : ''}}" data-current="0" bindtap="swichNav">A</view>
<view class="tab-item {{currentTab==1 ? 'on' : ''}}" data-current="1" bindtap="swichNav">B</view>

</view>
<swiper current="{{currentTab}}" class="swiper" duration="300" style="height:{{winHeight - 30}}px" bindchange="bindChange">
<swiper-item>
<view>
<view class="container">
  <ec-canvas id="radar1-dom-graph" canvas-id="radar1-graph" ec="{{ ec1 }}"></ec-canvas>
</view>
</view>
</swiper-item>
<swiper-item>
<view>
<view class="container">
  <ec-canvas id="radar2-dom-graph" canvas-id="radar2-graph" ec="{{ ec2 }}"></ec-canvas>
</view>
</view>
</swiper-item>

</swiper>
```css
.container {
  position: absolute;
  top: 0;
  bottom: 0;
  left: 0;
  right: 0;

  display: flex;
  flex-direction: column;
  align-items: center;
  justify-content: space-between;
  box-sizing: border-box;
}
.swiper-tab{
  width: 100%;
  text-align: center;
  line-height: 80rpx;
  border-bottom: 1px solid #000;
  display: flex;
  flex-direction: row;
  justify-content: center;
  }
  .tab-item{
  flex: 1;
  font-size: 30rpx;
  display: inline-block;
  color: #777777;
  }
  .on{
  color: red;
  border-bottom: 5rpx solid red;
  }
  .swiper{ display: block; height: 100%; width: 100%; overflow: hidden; }
  .swiper view{
  text-align: center;
  padding-top: 100rpx;
  }

  ec-canvas {
    width: 100%;
    height: 100%;
  }

  page{
    background: #f3f7f7;
  }
```
目前看只能实现你的第3个需求,就是点击那个小圆圈跳转对应的页面,在点击到雷达图外面和雷达图顶点处的文字和值顶点的文字,都无法触发跳转(文字都在雷达图外面,无法进行跳转)。圈里面才可以触发click事件。
点中小红圈,弹出对话框:
点击小红圈,弹出对话框代码如下:
myChart.setOption(option)
myChart.on('click', (param) => {
  console.log(param)
  if(param.event.topTarget.__dimIdx != undefined)
      alert(param.event.topTarget.__dimIdx);//可以在这里实现跳转,根据索引0 1 2确定跳转页面
你好,我是有问必答小助手,非常抱歉,本次您提出的有问必答问题,目前超出我们的服务范围,暂时无法为您解答。
首次提问人员可免费体验一次有问必答服务。目前首次提问的问题服务范围为:编程语言、Java开发、python、数据库、前端开发 领域专业技术问题,为您提供问题的解决思路和指导。
不提供源码代写、项目文档代写、论文代写、作业题目代写、安装包资源发送或安装、软件使用指导等服务。
我们后续会持续优化,扩大我们的服务范围,为您带来更好地服务。
参考:https://blog.csdn.net/julia_0502/article/details/110475591
- 问题:点击echarts图的点,跳转到相应的页面
- 解决:给点设置点击事件,然后在点击的时候出发方法跳转页面;
设置点击事件:
chart.on('click', (param) => {
console.log(param)
})
点击回调的param是整个雷达图的数据,我们要从中找到我们想要的数据(对应indicator的数据),通过每次改变点击的indicator,然后再去观察数据,最后发现在event-topTarget中有个__dimIdx字段,对应的刚好说我点击的indicator在数据集合中对应的index:
那我们就可以通过这个index从数据集合中获取到点击的这个indicator节点数据了:
chart.on('click', (param) => {
console.log(param)
console.log(option.radar.indicator)
console.log(option.radar.indicator[param.event.topTarget.__dimIdx])
})
最后获取到的数据如下,我们便可以用节点的数据来处理后面的业务了:
echarts雷达图点击事件 获取indicator节点详情_谈谈的心情的博客-CSDN博客_echart indicator
需求:点击雷达图上的indicator时获取对应indicator上的信息,而不是获取整个系列的数据1、设置点击事件:chart.on('click', (param) => { console.log(param)})点击回调的param是整个雷达图的数据,我们要从中找到我们想要的数据(对应indicator的数据),通过每次改变点击的indicator,然后再去观察数据,最后发现在event-topTarget中有个__dimIdx字段,对应的刚好说我点击的indicat.
https://blog.csdn.net/ljw124213/article/details/121330367
您好,我是有问必答小助手,您的问题已经有小伙伴帮您解答,感谢您对有问必答的支持与关注!PS:问答VIP年卡 【限时加赠:IT技术图书免费领】,了解详情>>> https://vip.csdn.net/askvip?utm_source=1146287632