MATLAB中plot函数无法识别
在用MATLAB画函数图像时出现这个问题,这个是什么问题・_・?该怎么办呀
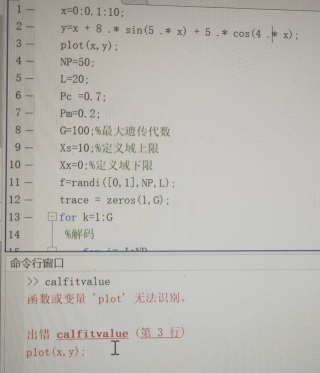
这一部分运行没有问题
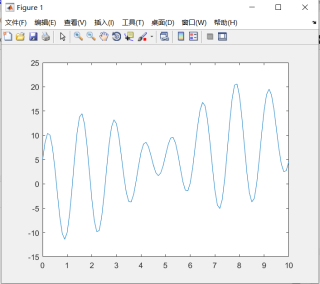
x=0:0.1:10;
y=x+8.*sin(5.*x)+5.*cos(4.*x);
plot(x,y);
NP=50;
L=20;
Pc =0.7;
Pm=0.2;
G=100;%最大遗传代数
Xs=10;%定义域上限
Xx=0;%定义域下限
f=randi([0,1],NP,L);
trace = zeros(1,G);
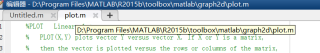
plot无法识别,最好看看plot路径对不对
你可以在命令行里打个 "help plot"
如果缺少,重新安装应该能解决
如果有,怀疑是你自定义了plot.m,重新找个文件夹写,应该能解决
你在plot前面figure试一试