在matplotlib中绘制多个子图后,怎么设置子图整体的x轴和y轴标签?
问题遇到的现象和发生背景
问题相关代码,请勿粘贴截图
运行结果及报错内容
我的解答思路和尝试过的方法
我想要达到的结果
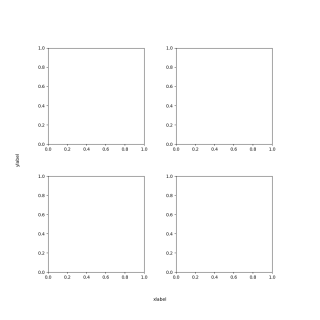
具体来说,就是怎么把这张图中的x轴和y轴标签分别移动到整体子图的中间位置。
感觉自己写的挺麻烦的,期待有简单的回答
import matplotlib.pyplot as plt

fig = plt.figure(figsize = (10, 10))

with plt.rc_context({'axes.edgecolor': 'white', 'xtick.color': 'white', 'ytick.color': 'white'}):
    ax_main = fig.add_axes([0.1, 0.1, 0.8, 0.8])
    ax_main.set_xlabel('xlabel')
    ax_main.set_ylabel('ylabel')

ax1 = fig.add_axes([0.15, 0.15, 0.3, 0.3])
ax2 = fig.add_axes([0.55, 0.15, 0.3, 0.3])
ax3 = fig.add_axes([0.15, 0.55, 0.3, 0.3])
ax4 = fig.add_axes([0.55, 0.55, 0.3, 0.3])

plt.show()