python!凭定位依据数据,对被定位数据前边和后边的数据分别求最值? 待大神!需要您给个代码哈!谢谢
python问题:df 在groupby 后,凭定位依据数据,对被定位数据前边和后边的数据分别求最值? 待大神!需要您给个代码哈!谢谢
a = pd.DataFrame({'year':[2018,2018,2018,2019,2019,2019,2019,2020,2020,2020,2020],'BoolCol': [1.2, 2.4, 3.7, 3.41, 4.58, 3.41, 4.0, 3.0, 7.0, 9.1, 7.0]})
b=pd.DataFrame({'year':[2018,2019,2020],'BoolCol': [1.2, 4.58, 7.0]})
#以上是数据简例,实际数据多,
问题是,我想先依据 b中的'BoolCol'的[1.2, 4.58, 7.0]数据作为定位依据数据。接着,对a按'year'进行groupby后,找出a的'BoolCol'列的每个group中的被定位数据,最终分别求出被定位数据之前的数据中的最大值;和被定位数据之后的数据中的最大值。
#例如a在groupby后,b中定位依据数据7.0对应的就应是a中的2020年的 'BoolCol'列中[3.0, 7.0, 9.1, 7.0]这样的数据list,这里假定要求定位依据数据7.0对应的被定位数据就是在list中的第一次出现的7.0(因为确实有可能多次出现同一数据,所以这里指定为首次出现的数据为被定位数据),之后再找出list中这个7.0前边的数据里的最大值,这里实际应该是3.0,但同时,若7.0就是第一个数据的时候,那么就指定7.0是应被找出的数值(最大值)。
这样被定位数据之前的数据中的最大值,应为一列数据[1.2, 3.41, 3.0]
同理!!被定位数据之后的数据中的最大值 ,应为一列数据[3.7, 4.0, 9.1] 以上为数据简例,实际数据较多
望有python大神现身,大神啊,需要给个代码哈!!!求助中!!!
直接上代码,亲测可用
import pandas as pd
import numpy as np

a = pd.DataFrame({'year':[2018,2018,2018,2019,2019,2019,2019,2020,2020,2020,2020],'BoolCol': [1.2, 2.4, 3.7, 3.41, 4.58, 3.41, 4.0, 3.0, 7.0, 9.1, 7.0]})
b = pd.DataFrame({'year':[2018,2019,2020],'BoolCol': [1.2, 4.58, 7.0]})
c = a.groupby('year')

b_left_max = []
b_right_max = []

for index,row in b.iterrows():
    year = row['year']
    boolcol = row['BoolCol']
    d = c.get_group(year)
    l = np.array(d['BoolCol']).tolist()
    e = l.index(boolcol)
    list_len = len(l)
    left = max(l[0:e]) if l[0:e] else boolcol
    right = max(l[e+1:list_len]) if l[e+1:list_len] else boolcol

    b_left_max.append(left)
    b_right_max.append(right)

print(b_left_max)
print(b_right_max)
结果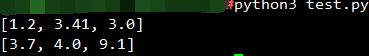
之前有人说用循环慢,那再改进一下:
import pandas as pd

def hander(record):
    year,boolcol = record
    src_list = c.get_group(year)['BoolCol'].tolist()
    index = src_list.index(boolcol)
    list_len = len(src_list)
    left = max(src_list[0:index]) if src_list[0:index] else boolcol
    right = max(src_list[index+1:list_len]) if src_list[index+1:list_len] else boolcol
    return [left,right]

a = pd.DataFrame({'year':[2018,2018,2018,2019,2019,2019,2019,2020,2020,2020,2020],'BoolCol': [1.2, 2.4, 3.7, 3.41, 4.58, 3.41, 4.0, 3.0, 7.0, 9.1, 7.0]})
b = pd.DataFrame({'year':[2018,2019,2020],'BoolCol': [1.2, 4.58, 7.0]})
c = a.groupby('year')

result = b.apply(hander, axis=1,result_type="expand")

b_left_max = result[0].tolist()
b_right_max = result[1].tolist()

print(b_left_max, b_right_max)
运行结果是一样的
df = pd.DataFrame({'year':[2018,2018,2018,2019,2019,2019,2019,2020,2020,2020,2020],'BoolCol': [1.2, 2.4, 3.7, 3.41, 4.58, 3.41, 4.0, 3.0, 7.0, 9.1, 7.0]})
print(df)
idx = df[(df.BoolCol==7.0)].index.tolist()
premax = df..head(idx[0]),max()
手工写的,没有仔细调试,要是采纳了,还有问题,可以帮你修改
可以看下pandas用法

Constructing DataFrame from a dictionary.

>>> d = {'col1': [1, 2], 'col2': [3, 4]}
>>> df = pd.DataFrame(data=d)
>>> df
   col1  col2
0     1     3
1     2     4
Notice that the inferred dtype is int64.

>>> df.dtypes
col1    int64
col2    int64
dtype: object
To enforce a single dtype:

>>> df = pd.DataFrame(data=d, dtype=np.int8)
>>> df.dtypes
col1    int8
col2    int8
dtype: object
Constructing DataFrame from numpy ndarray:

>>> df2 = pd.DataFrame(np.array([[1, 2, 3], [4, 5, 6], [7, 8, 9]]),
...                    columns=['a', 'b', 'c'])
>>> df2
   a  b  c
0  1  2  3
1  4  5  6
2  7  8  9