怎么给tooltip添加点击事件,点击某一块就会在图表下方显示tooltip中的数据
import React, { useState, useEffect } from 'react';
import ReactDOM from 'react-dom';
import { Column, G2 } from '@ant-design/plots';
import { PageHeaderWrapper } from '@ant-design/pro-layout';
import { useIntl } from 'umi';
import { Heatmap } from '@ant-design/plots';

const DemoHeatmap = () => {
  const [data, setData] = useState([]);

  useEffect(() => {
    asyncFetch();
  }, []);

  const asyncFetch = () => {
    fetch('json.json')
      .then((response) => response.json())
      .then((json) => setData(json))
      .catch((error) => {
        console.log('fetch data failed', error);
      });
  };

  G2.registerInteraction('element-link', {
    start: [
      {
        trigger: 'interval:mouseenter',
        action: 'element-link-by-color:link',
      },
    ],
    end: [
      {
        trigger: 'interval:mouseleave',
        action: 'element-link-by-color:unlink',
      },
    ],
  });

  const config = {
    data,
    xField: 'time',
    yField: 'eventname',
    colorField: 'value',
    shape: 'bar',
    sizeRatio: 0.5,
    color: ['#0d5fbb', '#7eadfc', '#fd8b6f', '#aa3523'],
    label: {
      style: {
        fill: '#fff',
        shadowBlur: 2,
        shadowColor: 'rgba(0, 0, 0, .45)',
      },
    },
    tooltip: {
      follow: true,
      enterable: true,
      offset: 5,
      customContent: (value, items) => {
        if (!items || items.length <= 0) return;
        const { data: itemData } = items[0];
        return (
          `<div class='container'>` +
          `<div class='box' style='padding: 10px 10px 10px 10px'>` +
          `<div class='title'>${itemData.time}</div>` +
          `<div class='tooltip-item' style='margin-top: 10px'><span>${itemData.eventname} </span><span>${itemData.value}  </span></div>` +
          `</div>` +
          `</div>`

        );

      },

    },
  };

  return <Heatmap {...config} />;
};

const Charts = () => {
  const intl = useIntl();
  return (
    <PageHeaderWrapper
      content={intl.formatMessage({
        id: 'pages.admin.subPage.title',
        defaultMessage: 'This page can only be viewed by admin',
      })}
    >
      <DemoHeatmap />
    </PageHeaderWrapper>
  );
};

export default Charts;
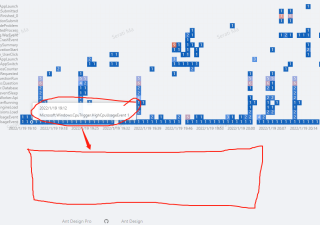
点击某一个数据,在图表下方显示tooltip中的数据
粗看了下,大概的思路:
1,找个地方写点击事件。
2,找到对应数据。
我去翻翻API
谢邀,给title的属性值可以是标签,看代码:
<Tooltip placement="topLeft" title={<span onClick={()=>{console.log('点我就对了!')}}>点我试试?</span>}>
    <Button>悬浮试试?</Button>
</Tooltip>