excel的数据通过pyecharts生成柱型图表,图中需要显示EXCEL中多个列数据
- 现在有一学生各位成绩表格,需要通过pyecharts生成柱型图表,图中需要显示EXCEL中各科成绩列数据
import numpy as np
import pandas as pd
from pyecharts.charts import Bar
filepath = r'/Users/allen/Downloads/my1stCharts.html'
df = pd.read_excel("/Users/allen/Downloads/Testresults1.xlsx", sheet_name="Sheet1", header=0)
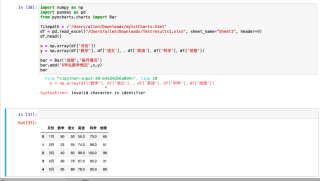
df.head()
x = np.array(df['月份'])
y = np.array(df['数学'],df['语文'],,df['英语'],df['科学'],df['地理'])
bar = Bar('成绩','每月情况')
bar.add('X学生数学情况',x,y)
bar
语法错误,第10行df['语文'],,df['英语']多了个逗号