使用前端V-chart框架创建柱状图图表横着显示,请问如何正常显示
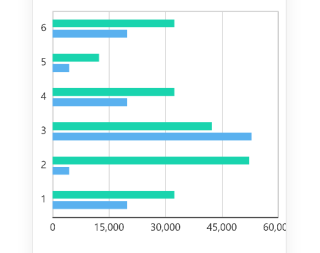
想做到以下这种正常显示请问该怎么办呢
以下是代码
```javascript
<template>
  <div>
    <ve-bar :data="chartData"
            :settings="chartSettings"
            :extend="chartExtend"
    ></ve-bar>
  </div>
</template>

<script>
  export default {
    name: "BarChart",
    data() {
      return {
        chartData: {
          columns: ['横轴', 'planUse', 'realUse'],
          rows: [
            { '横轴': '1', 'planUse': 32371, 'realUse': 19810 },
            { '横轴': '2', 'planUse': 52328, 'realUse': 4398 },
            { '横轴': '3', 'planUse': 42381, 'realUse': 52910 },
            { '横轴': '4', 'planUse': 32371, 'realUse': 19810 },
            { '横轴': '5', 'planUse': 12328, 'realUse': 4398 },
            { '横轴': '6', 'planUse': 32371, 'realUse': 19810 },

          ]
        },
        chartSettings: {
          labelMap: {
            planUse: '计划用水',
            realUse: '实际用水'
          }
        },
        chartExtend: {
          barWidth: 10,
          height: 'auto',
          grid: {
            show: true,
            borderWidth: 1
          },
          xAxis: {
            gridIndex: 0,
            position: 'bottom',
            type: "time"
          },
          yAxis: {
            show: true
          }
        }
      }
    },
  }
</script>

<style scoped>

</style>
```
改下试试
          yAxis: {
           type: "value",
          }
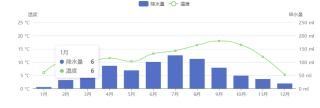
参考:
option = {
  tooltip: {
    trigger: 'axis',
    axisPointer: {
      type: 'cross',
      crossStyle: {
        color: '#999'
      }
    }
  },
  toolbox: {
    feature: {
      dataView: { show: true, readOnly: false },
      magicType: { show: true, type: ['line', 'bar'] },
      restore: { show: true },
      saveAsImage: { show: true }
    }
  },
  legend: {
    data: ['Evaporation', 'Precipitation', 'Temperature']
  },
  xAxis: [
    {
      type: 'category',
      data: ['Mon', 'Tue', 'Wed', 'Thu', 'Fri', 'Sat', 'Sun'],
      axisPointer: {
        type: 'shadow'
      }
    }
  ],
  yAxis: [
    {
      type: 'value',
      name: 'Precipitation',
      min: 0,
      max: 250,
      interval: 50,
      axisLabel: {
        formatter: '{value} ml'
      }
    },
    {
      type: 'value',
      name: 'Temperature',
      min: 0,
      max: 25,
      interval: 5,
      axisLabel: {
        formatter: '{value} °C'
      }
    }
  ],
  series: [
    {
      name: 'Evaporation',
      type: 'bar',
      tooltip: {
        valueFormatter: function (value) {
          return value + ' ml';
        }
      },
      data: [
        2.0, 4.9, 7.0, 23.2, 25.6, 76.7, 135.6, 162.2, 32.6, 20.0, 6.4, 3.3
      ]
    },
    {
      name: 'Precipitation',
      type: 'bar',
      tooltip: {
        valueFormatter: function (value) {
          return value + ' ml';
        }
      },
      data: [
        2.6, 5.9, 9.0, 26.4, 28.7, 70.7, 175.6, 182.2, 48.7, 18.8, 6.0, 2.3
      ]
    },
    {
      name: 'Temperature',
      type: 'line',
      yAxisIndex: 1,
      tooltip: {
        valueFormatter: function (value) {
          return value + ' °C';
        }
      },
      data: [2.0, 2.2, 3.3, 4.5, 6.3, 10.2, 20.3, 23.4, 23.0, 16.5, 12.0, 6.2]
    }
  ]
};

直接canvas自己画, 就这么几根柱子, 1,2个小时就画完了。
您好,我是有问必答小助手,您的问题已经有小伙伴帮您解答,感谢您对有问必答的支持与关注!PS:问答VIP年卡 【限时加赠:IT技术图书免费领】,了解详情>>> https://vip.csdn.net/askvip?utm_source=1146287632