matplotlab 绘制曲线簇并进行标记
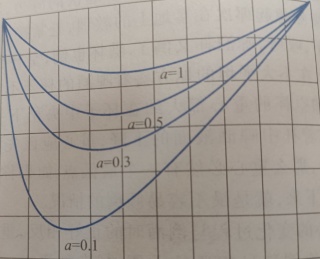
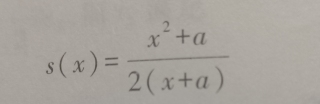
如图,如何使用matplotlib绘制a取值不同时对应的曲线s(x)并在曲线附近进行标记?
希望这些能够帮到你:
如何使用matplotlib绘制一个函数的图像:https://www.cnblogs.com/sheeva/p/5780784.html
Matplotlib之figure函数实现多图显示和一图多个函数显示:https://blog.csdn.net/beautiful77moon/article/details/96475964
matplotlib之pyplot模块——添加文本、注解(text、annotate):https://blog.csdn.net/mighty13/article/details/115462893