pyecharts x轴标签文字过多导致显示不全 如何更改
问题遇到的现象和发生背景
pyecharts x轴标签文字过多导致显示不全 如何更改,网上只有echarts的解决方法,旋转坐标轴名字。但是我手上代码是学习发的,上面没有这个角度值,我也不知道怎么补充上去。
问题相关代码,请勿粘贴截图
#折线图
import pyecharts.options as opts
from pyecharts.charts import Line
line = Line()
line.set_global_opts(title_opts=opts.TitleOpts(title="豆瓣影评人数top10电影"))
line.add_xaxis(["肖申克的救赎", "这个杀手不太冷", "千与千寻", "阿甘正传", "霸王别姬", "泰坦尼克号", "我不是药神", "盗梦空间", "三傻大闹宝莱坞", "疯狂动物城"])
line.add_yaxis("影片评价人数top10", [2529510, 2060322, 1981694, 1900413, 1880377, 1862155, 1847187, 1825058, 1659816, 1657343])
line.render("top10折线图.html")
运行结果及报错内容
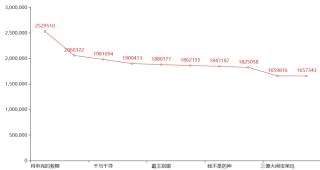
x轴只能显示出5个电影名称,其他的需要鼠标移动到折线图上才可以显示
我的解答思路和尝试过的方法
寻找 倾斜x轴信息的方法,没有pyecharts的
我想要达到的结果
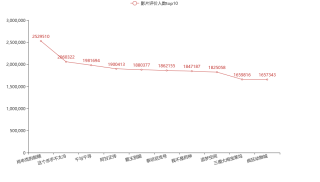
旋转x轴上显示的信息,让字体竖着显示,从而让图表信息显示完全
Name: pyecharts
Version: 1.7.1
import pyecharts.options as opts
from pyecharts.charts import Line
line = Line()
line.set_global_opts(title_opts=opts.TitleOpts(title="豆瓣影评人数top10电影"))
line.add_xaxis(["肖申克的救赎", "这个杀手不太冷", "千与千寻", "阿甘正传", "霸王别姬", "泰坦尼克号", "我不是药神", "盗梦空间", "三傻大闹宝莱坞", "疯狂动物城"]
               )
line.add_yaxis("影片评价人数top10", [2529510, 2060322, 1981694, 1900413, 1880377, 1862155, 1847187, 1825058, 1659816, 1657343])
line.set_global_opts(xaxis_opts=opts.AxisOpts(name_rotate=60, axislabel_opts={"rotate": 15}))

line.render("top10折线图.html")
attr = ["{}天".format(i) for i in range(20)]
v1 = [random.randint(1, 20) for _ in range(20)]
bar = Bar("坐标轴标签旋转示例")
bar.add("", attr, v1, xaxis_interval=0, xaxis_rotate=30, yaxis_rotate=30)
bar.render()

PS:问答VIP年卡 【限时加赠:IT技术图书免费领】,了解详情>>> https://vip.csdn.net/askvip?utm_source=1146287632
https://blog.csdn.net/qq_42374697/article/details/105653453 [pyecharts学习笔记]——全局配置项(AxisOpts坐标轴配置项)
这个也很详细,大家一起加油