怎么让echarts的柱状图 y轴从最小值开始显示?
问题遇到的现象和发生背景
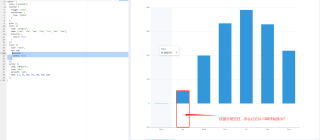
如图:我想让蓝色柱子,从-100开始显示
问题相关代码,请勿粘贴截图
运行结果及报错内容
我的解答思路和尝试过的方法
我想要达到的结果
yAxis: {
    type: 'value',
    axisLabel: {
      formatter: (value) => value + (-800)
    }
  }
800是你数据的最小值,需要注意的是这样修改不显示0标线
xAxis: {
    type: 'category',
    data: ['Mon', 'Tue', 'Wed', 'Thu', 'Fri', 'Sat', 'Sun'],
    axisLine:{
        show:true,
        onZero:false
    }
},
yAxis: {
    type: 'value',
    data:[200,100,0,-100,-200],
},
series: [{
    data: [-120, -200, -150, -80, -70, -110, -130],
    type: 'bar'
}]