我这个图上边的坐标都重叠在一起了,怎么让它分开?
我这个图上边的坐标都重叠在一起了
import matplotlib.pyplot as plt
import numpy as np


x = [1,3,6,4,4,4,4,4,9]
y = [1,2,3,4,5,5,5,5,9]
c = []
txt = []
for i in range(len(x)):

    if x[i] == y[i]:
        c.append("green")
        txt.append([x[i], y[i], ""])
    else:
        c.append("red")
        txt.append([x[i], y[i], "{},{}".format(x[i], y[i])])


colors = np.array(c)

plt.scatter(x, y, c=colors)
for i in txt:
    plt.annotate(i[2],xy=(i[0],i[1]))

plt.show()
运行结果:
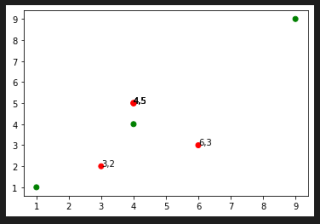
我想要达到的结果:
1.让红点上边的坐标分开显示,如果坐标相同就显示一个就行;如果不相同就分开显示。
2.然后将红点上的坐标print出来。
其他没细看
这里有两组刚好相反
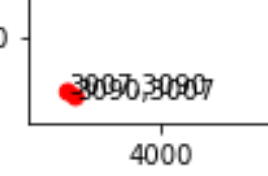
[3007, 3090] 和 [3090,3007]
这样的算一组吗?
import matplotlib.pyplot as plt
import numpy as np

x = [1, 3, 6, 4, 4, 4, 4, 4, 9]
y = [1, 2, 3, 4, 5, 5, 5, 5, 9]
data = []
z = set(zip(x,y))
for d in z:
    if d[0] == d[1]:
        data.append([d[0], d[1], "", "green"])
    else:
        print(d)
        data.append([d[0], d[1], "{},{}".format(d[0], d[1]), "red"])

x1 = [x[0] for x in data if x[3]=="red"]
y1 = [x[1] for x in data if x[3]=="red"]
c1 = [x[3] for x in data if x[3]=="red"]
t1 = [[x[0],x[1],x[2]] for x in data if x[3]=="red"]

plt.scatter(x1, y1, c=c1)
for i in t1:
    plt.annotate(i[2], xy=(i[0], i[1]))
plt.show()