Matplotlib极坐标图不会放大
ax1 = plt.subplot(121, projection='polar')
y_seldam = [2.7557652971254347, 4.66073332941971, 2.7854547732004784, 2.2292809938986355, 2.338617070327457, 2.320833179569971, 2.9154258693642707, 2.4417546378918185, 2.234296124979803, 2.4574677771152804, 3.4695244335084396, 2.467447104034753, 3.51566551709059]
y_cav = [1.3091436018541167, 1.0812749499345997, 1.2470756274480126, 1.3531448596025657, 1.8982789891294345, 1.8897044943410326, 2.0218460353765817, 2.0026140892618467, 2.021880927769014, 2.499198623367015, 2.715693026361406, 2.588018022208732, 1.6936489128775856]
theta = [i*np.pi/6.5 for i in range(13)]
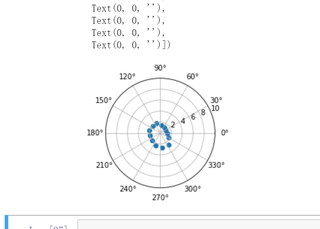
ax1.set_rlim(0,10)
ax1.scatter(theta, y_cav, linewidth=3,lw=1)
ax1.set_thetagrids(np.arange(0.0, 360.0, 30.0))