python中的画图坐标问题
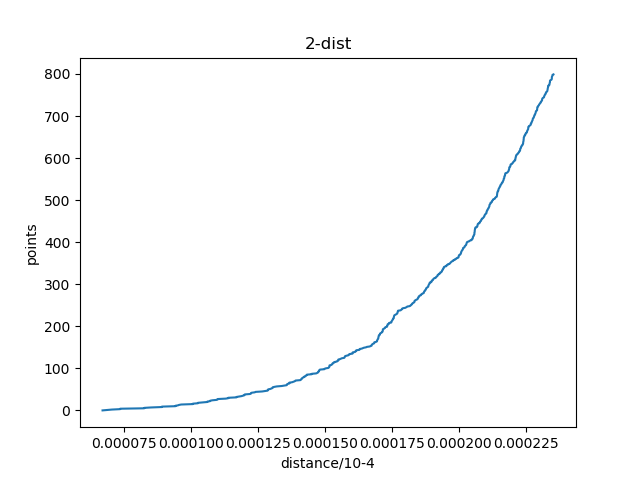
这个是我用python画的图
我想实现以下两个目标的任意一个:
1.鼠标点在图上就可以显示该点的横纵坐标
2.从图的中间某位置画一条竖线,将该曲线分成两部分,并能求出这条直线与曲线的交点坐标
刚学python,很多东西都不会,希望大家不吝赐教
谢谢
https://blog.csdn.net/u013419318/article/details/85076094
-*- coding: utf-8 -*-
#任意两条曲线的交点坐标.py
import matplotlib.pyplot as plt
import numpy as np
x1 =np.linspace(-6*np.pi, 6*np.pi, 256,endpoint=True)
y2=np.sin(x1 )
y1=0.05*x1-.005
fig,ax=plt.subplots(1,1,figsize=(15,8))
plt.plot(x1,y1)#,marker='o'
plt.plot(x1,y2)#,marker='o'
data = y1-y2
doublediff =np.sign( np.diff(np.sign(np.diff(data))))
#print(doublediff)
peak_locations = np.where(doublediff == -1)[0]
#print(peak_locations)
doublediff2 = np.sign(np.diff(np.sign(np.diff(-1*data))))
trough_locations = np.where(doublediff2 == -1)[0]
#print(trough_locations)
ax.plot(x1[peak_locations], y2[peak_locations] , '^', markersize=10, color='m')
ax.plot(x1[trough_locations],
y2[trough_locations] ,
'^', markersize=10, color='m')
ax.set_title('title test',fontsize=12,color='r')
plt.show()
singl=np.diff(np.sign((data)))
up_locations=np.where(singl==2)[0]
down_locations=np.where(singl==-2)[0]
fig,ax=plt.subplots(1,1,figsize=(15,8))
plt.plot(x1,y1)#,marker='o'
plt.plot(x1,y2)#,marker='o'
ax.plot(x1[up_locations], y2[up_locations] , 'v', markersize=10, color='tab:green')
ax.plot(x1[down_locations],
y2[down_locations] ,
'^', markersize=10, color='m')
x = x1[up_locations]#np.arange(0, 6)
y = y1[up_locations]#x * x
for xy in zip(x, y):
plt.annotate("(%s,%s)" % xy, xy=xy, xytext=(-20, 10), textcoords='offset points',color='tab:green')
x1 = x1[down_locations]#np.arange(0, 6)
y1 = y1[down_locations]#x * x
for x1y1 in zip(x1, y1):
plt.annotate("(%s,%s)" % x1y1, xy=x1y1, xytext=(-20, -10), textcoords='offset points',color='tab:red')
#plt.plot(x1[:255],singl)
plt.title(' 任意两条曲线的交点坐标 ')
plt.show()