如何用matlab自带的代码实现copula函数
现在有一组风速风向数据(u1,u2),u1是风速0m/s-40m/s,u2是风向0°-360°
风速用的是gamma分布拟合的
风向用的是four-component the mixture of von Mises分布拟合的
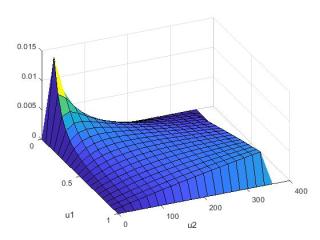
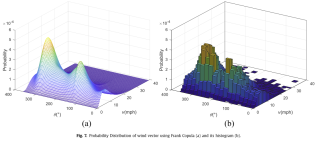
如何用matlab只带的frank copula函数,生成下面左边的图形,右边是原数据的概率图
我试着用了matlab帮助里面的copulapdf例子(下面代码是帮助里的例子),他那个必须u1和u2都是同样的数,我把风速数据带进去就全为0,可能是我理解有问题。
u = linspace(0,1,10);
[u1,u2] = meshgrid(u,u);
y = copulapdf('Frank',[u1(:),u2(:)],1);
surf(u1,u2,reshape(y,10,10))
xlabel('u1')
ylabel('u2')
他这个是归一化的,也就是u必须在0~1之间,其它地方都是0
你看输入说明:
Values at which to evaluate the pdf, specified as a matrix of scalar values in the range [0,1]. If u is an n-by-p matrix, then its values represent n points in the p-dimensional unit hypercube. If u is an n-by-2 matrix, then its values represent n points in the unit square.
If you specify a bivariate Archimedean copula type ('Clayton', 'Frank', or 'Gumbel'), then u must be an n-by-2 matrix.
clc;clear
u = linspace(0,1,20);
[u1,u2] = meshgrid(u);
y = copulapdf('Clayton',[u1(:),u2(:)],1,1);
surf(u1,u2*360,reshape(y,size(u1))/360) % 一个拉长,一个就要缩短
xlabel('u1')
ylabel('u2')