为什么matplotlib中无法改变tickline的颜色?
系统是mac os,matplotlib版本3.3.4, 代码如下
%matplotlib inline
from calendar import day_name
from matplotlib.ticker import FormatStrFormatter

fig = plt.figure()
ax = fig.add_axes([0.3, 0.3, 0.7, 0.7])

ax.spines['bottom'].set_position(('outward', 10))
ax.spines['left'].set_position(('outward', 10))
ax.spines['right'].set_color('none')
ax.spines['top'].set_color('none')

x = np.arange(1, 8, 1)
y = 2*x + 1

ax.scatter(x, y, c='orange', s=50, edgecolors='orange')

for tickline in ax.xaxis.get_ticklines():
    tickline.set_color('blue')
    tickline.set_markersize(7)  # marker 的长度
    tickline.set_markeredgewidth(5) # marker 的宽度

for ticklabel in ax.xaxis.get_majorticklabels():
    ticklabel.set_color('slateblue')
    ticklabel.set_fontsize(15)
    ticklabel.set_rotation(20)

# for ticklabel in ax.get_xmajorticklabels():
#     ticklabel.set_color('slateblue')
#     ticklabel.set_fontsize(15)
#     ticklabel.set_rotation(20)     #与上面循环等效

ax.yaxis.set_major_formatter(FormatStrFormatter('$\yen%1.1f$'))
plt.xticks(x, day_name[0:7], rotation=20)  # 前面已经rotation了,所以,这里不写也没关系
ax.yaxis.set_ticks_position('left')
ax.xaxis.set_ticks_position('bottom')

for tickline in ax.yaxis.get_ticklines():
    tickline.set_color('lightgreen')
    tickline.set_markersize(8)
    tickline.set_markeredgewidth(5)

for ticklabel in ax.get_yticklabels():
    ticklabel.set_color('green')
    ticklabel.set_fontsize(18)

ax.grid(True, ls=':', lw=1, color='gray', alpha=0.5)


plt.show()
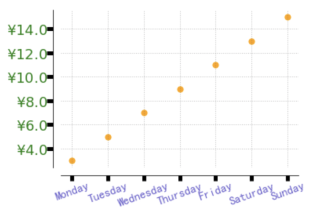
效果截图:这个inline或者调用弹窗也就是%matplotlib auto的结果相同
tickline.set_color("blue")
改为:tickline.set_markeredgecolor("blue")