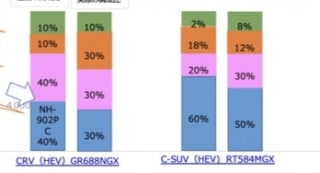
这种图怎么画呢,柱状堆积图

在官网上就有示例,你可以参考一下
option = {
  tooltip: {
    trigger: 'axis',
    axisPointer: {
      // Use axis to trigger tooltip
      type: 'shadow' // 'shadow' as default; can also be 'line' or 'shadow'
    }
  },
  legend: {},
  grid: {
    left: '3%',
    right: '4%',
    bottom: '3%',
    containLabel: true
  },
  xAxis: {
    type: 'category',

  },
  yAxis: {
    type: 'value',
    data: ['Mon', 'Tue', 'Wed', 'Thu', 'Fri', 'Sat', 'Sun']
  },
  series: [
    {
      name: 'Direct',
      type: 'bar',
      stack: 'total',
      label: {
        show: true
      },
      emphasis: {
        focus: 'series'
      },
      data: [320, 302, 301, 334, 390, 330, 320]
    },
    {
      name: 'Mail Ad',
      type: 'bar',
      stack: 'total',
      label: {
        show: true
      },
      emphasis: {
        focus: 'series'
      },
      data: [120, 132, 101, 134, 90, 230, 210]
    },
    {
      name: 'Affiliate Ad',
      type: 'bar',
      stack: 'total',
      label: {
        show: true
      },
      emphasis: {
        focus: 'series'
      },
      data: [220, 182, 191, 234, 290, 330, 310]
    },
    {
      name: 'Video Ad',
      type: 'bar',
      stack: 'total',
      label: {
        show: true
      },
      emphasis: {
        focus: 'series'
      },
      data: [150, 212, 201, 154, 190, 330, 410]
    },
    {
      name: 'Search Engine',
      type: 'bar',
      stack: 'total',
      label: {
        show: true
      },
      emphasis: {
        focus: 'series'
      },
      data: [820, 832, 901, 934, 1290, 1330, 1320]
    }
  ]
};

上面是官方示例修改版,下面是自定义版本
option = {
  tooltip: {
    trigger: 'axis',
    axisPointer: {
      // Use axis to trigger tooltip
      type: 'shadow' // 'shadow' as default; can also be 'line' or 'shadow'
    }
  },
  legend: {},
  grid: {
    left: '3%',
    right: '4%',
    bottom: '3%',
    containLabel: true
  },
  xAxis: {
    type: 'category'
  },
  yAxis: {
    type: 'value',
    data: ['Mon', 'Tue', 'Wed', 'Thu', 'Fri', 'Sat', 'Sun']
  },
  series: [
    {
      name: 'Direct',
      type: 'bar',
      stack: 'total',
      label: {
        show: true,
         normal: {
            show: true,
            formatter: '{c}%',

            textStyle: {
                color: "#000",
                fontSize: 14
            }
        }
      },
      emphasis: {
        focus: 'series'
      },
      data: [320, 302, 301, 334, 390, 330, 320]
    },
    {
      name: 'Mail Ad',
      type: 'bar',
      stack: 'total',
      label: {
        show: true,
        normal: {
            show: true,
            formatter: '{c}%',
            textStyle: {
                color: "#000",
                fontSize: 14
            }
        }
      },
      emphasis: {
        focus: 'series'
      },
      data: [120, 132, 101, 134, 90, 230, 210]
    },
    {
      name: 'Affiliate Ad',
      type: 'bar',
      stack: 'total',
      label: {
        show: true,
        normal: {
            show: true,
            formatter: '{c}%',
            textStyle: {
                color: "#000",
                fontSize: 14
            }
        }
      },
      emphasis: {
        focus: 'series'
      },
      data: [220, 182, 191, 234, 290, 330, 310]
    },
    {
      name: 'Video Ad',
      type: 'bar',
      stack: 'total',
      label: {
        show: true,
        normal: {
            show: true,
            formatter: '{c}%',
            textStyle: {
                color: "#000",
                fontSize: 14
            }
        }
      },
      emphasis: {
        focus: 'series'
      },
      data: [150, 212, 201, 154, 190, 330, 410]
    },
    {
      name: 'Search Engine',
      type: 'bar',
      stack: 'total',
      label: {
        show: true,
        normal: {
            show: true,
            formatter: '{c}%',
            textStyle: {
                color: "#000",
                fontSize: 14
            }
        }
      },
      emphasis: {
        focus: 'series'
      },
      data: [820, 832, 901, 934, 1290, 1330, 1320]
    }
  ]
};

这是自定义的.有帮助请采纳
官方示例不是有吗,你要的是分组堆叠是吧

option = {
  tooltip: {
    trigger: 'axis',
    axisPointer: {
      type: 'shadow'
    }
  },
  grid: {
    left: '3%',
    right: '4%',
    bottom: '3%',
    containLabel: true
  },
  xAxis: [
    {
      type: 'category',
      data: ['Mon', 'Tue', 'Wed', 'Thu', 'Fri', 'Sat', 'Sun']
    }
  ],
  yAxis: [
    {
      type: 'value'
    }
  ],
  series: [
    {
      name: 'Direct',
      type: 'bar',
      stack: 'A',
      data: [320, 332, 301, 334, 390, 330, 320]
    },
    {
      name: 'Email',
      type: 'bar',
      stack: 'A',
      data: [120, 132, 101, 134, 90, 230, 210]
    },
    {
      name: 'Union Ads',
      type: 'bar',
      stack: 'A',
      data: [220, 182, 191, 234, 290, 330, 310]
    },
    {
      name: 'Video Ads',
      type: 'bar',
      stack: 'B',
      data: [150, 232, 201, 154, 190, 330, 410]
    },
    {
      name: 'Search Engine',
      type: 'bar',
      stack: 'B',
      data: [862, 1018, 964, 1026, 1679, 1600, 1570],
    },
    {
      name: 'Baidu',
      type: 'bar',
      stack: 'B',
      data: [620, 732, 701, 734, 1090, 1130, 1120]
    },
    {
      name: 'Google',
      type: 'bar',
      stack: 'C',
      data: [120, 132, 101, 134, 290, 230, 220]
    },
    {
      name: 'Bing',
      type: 'bar',
      stack: 'C',
      data: [60, 72, 71, 74, 190, 130, 110]
    },
    {
      name: 'Others',
      type: 'bar',
      stack: 'C',
      data: [62, 82, 91, 84, 109, 110, 120]
    }
  ]
};