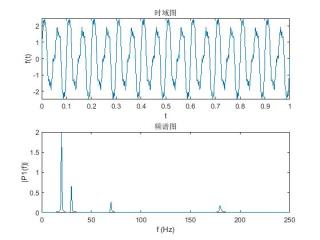
这个函数如何显示出波形图
逆傅里叶变化,显示出波形图
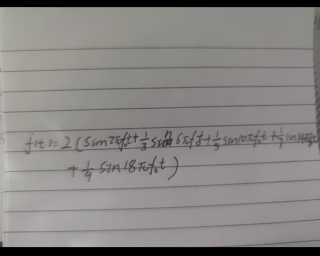
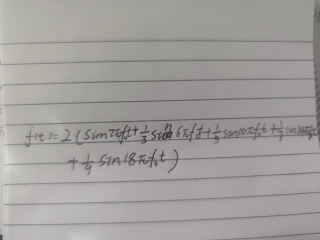
大玉米你好,可不可以把f0之类的参数告知啊
f = 10;
f0 = 20;
fs = 500; % 这个是f和f0中最大的那个值的25~30倍以上为好
dt = 1/fs;
f = @(t) 2*(sin(2*pi*f0*t) + 1/3*sin(6*pi*f*t)+1/5*sin(10*pi*f)+1/7*sin(14*pi*f*t) + 1/9*sin(18*pi*f0*t));
t = 0:dt:1;%持续一秒
y = f(t);
L = length(t);
Y = fft(y);
P2 = abs(Y/L);
P1 = P2(1:floor(L/2)+1);
P1(2:end-1) = 2*P1(2:end-1);
Freq = fs*(0:floor(L/2))/L;
figure(1);clf;
subplot(2,1,1)
plot(t,y)
title('时域图')
xlabel('t')
ylabel('f(t)')
subplot(2,1,2)
plot(Freq,P1)
title('频谱图')
xlabel('f (Hz)')
ylabel('|P1(f)|')