请问这个用matlab如何作图?
你好同学,代码供参考
odefun = @(x,y) [-y(2) + sin(x); y(3)+exp(x); -y(1) - y(2) + 1];
[x,y] = ode45(odefun, [0,20], [0;0;1]);
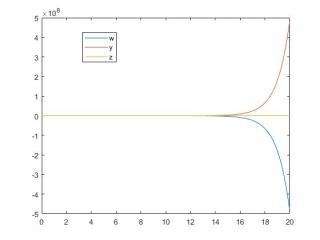
plot(x,y)
legend('w','y','z')
效果:
你好同学,代码供参考
odefun = @(x,y) [-y(2) + sin(x); y(3)+exp(x); -y(1) - y(2) + 1];
[x,y] = ode45(odefun, [0,20], [0;0;1]);
plot(x,y)
legend('w','y','z')
效果: