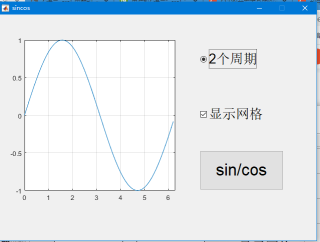
利用matlab制作图形显示界面,在sin和cos图像切换同时选择是否采用两个周期图和显示网格
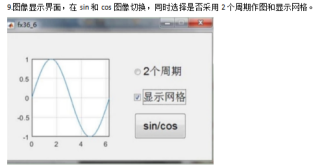
希望能在写下详细注释
sincos_OpeningFcn里头:
x = 0:0.1:2*pi;
y = sin(x);
axes(handles.axes1);
plot(x,y);
axis([0 2*pi -1 1]);
pushbutton1_Callback 里头:
global sinorcos;
if sinorcos==0
    sinorcos = 1;
else
    sinorcos = 0;
end
checked = get(handles.radiobutton1,'value');
boxchecked = get(handles.checkbox1,'value');

if checked==1
    x=0:0.1:2*pi;
else
    x=0:0.1:pi;
end

if sinorcos==1
    y=sin(x);
else
    y=cos(x);
end
axes(handles.axes1);
plot(x,y);

if checked==1
    axis([0 2*pi -1 1]);
else
    axis([0 pi -1 1]);
end

if boxchecked==1
    grid on;
end
checkbox1_Callback 里头:
pushbutton1_Callback(hObject, eventdata, handles);
radiobutton1_Callback 里头也是
pushbutton1_Callback(hObject, eventdata, handles);