MATLAB作业题,有人能看一下嘛
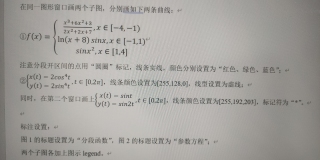
你好,代码仅供参考
clc;clear
% (1) 第一题
f1 = @(x) (x.^3+6*x.^2+3)./(2*x.^2+2*x+7);
f2 = @(x) log(x+8).*sin(x);
f3 = @(x) sin(x.^2);
figure(1)
subplot(1,2,1)
t = -4:0.01:-1;
plot(t,f1(t),'r-'); hold on
t = -1:0.01:1;
plot(t,f2(t),'g-'); hold on
t = 1:0.01:4;
plot(t, f3(t),'b-');
plot([-1, 1],[f1(-1),f2(1)],'o')%标记分段开区间
title('分段函数')
legend('分段1','分段2','分段3','开区间圆圈')
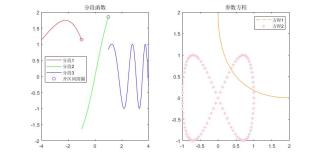
%(2)第二题
subplot(1,2,2)
x = @(t) 2*cos(t).^4;
y = @(t) 2*sin(t).^4;
t = linspace(0,2*pi,101);
plot(x(t),y(t),'--','color',[255,128,0]/255)
hold on
x = @(t) sin(t);
y = @(t) sin(2*t);
plot(x(t),y(t),'*','color',[255,192,203]/255)
title('参数方程')
legend('方程1','方程2')
%【用户设置】
%【第一窗口中 x点间隔】
div =0.1;

%【第二窗口中 t点间隔】
div2 = 0.2;

%第一窗口
subplot(1,2,1);
% x1 [-4,-1)
x1=-4:div:-1;
fx1=(x1.^3+6*x1.^2+3)./(2*x1.^2+2*x1+7);
plot(x1,fx1,'r');
hold on;

% x2 [-1,1)
x2=-1:div:1;
fx2=log(x2+8).*sin(x2);
plot(x2,fx2,'g');
hold on;

% x3 [1,4]
x3=1:div:4;
fx3=sin(x3.^2);
plot(x3,fx3,'b');
hold on;


%边界
plot(x1(end),fx1(end),'or');
hold on;
plot(x2(end),fx2(end),'og');
hold on;

xlabel('x');
ylabel('y');

grid on;
title('分段函数');


legend('fx1=(x1.^3+6*x1.^2+3)./(2*x1.^2+2*x1+7) ~[-4,-1)',...
    'fx2=log(x2+8).*sin(x2)  ~[-1,1)',...
    'fx3=sin(x3.^2) ~[1,4]',...
    'Location','best');

%第二窗口
subplot(1,2,2);

t=0:div2:2*pi;
xt=2*(cos(t)).^4;
yt=2*(sin(t)).^4;
h=plot(xt,yt,'--');
h.Color=[255/255,128/255,0];
hold on;

xt_=sin(t);
yt_=sin(2*t);
h=plot(xt_,yt_,'*-');
h.Color=[255/255,192/255,203/255];
grid on;

legend('x=2*(cos(t)).^4 ;y=2*(sin(t)).^4   ~[0,2\pi] ','x=sin(t) ; y=sin(2*t) ~[0,\pi]','Location','best');

xlabel('x');
ylabel('y');
title('参数方程');

我感觉 t参数的间隔选取会严重影响图形的形状!