使用MATLAB,按要求完成图中的问题

1.用不同的颜色、线型、线宽
2.设置XY轴的范围及坐标说明
3.不同曲线要有对应的图例说明
4.利用五角星或其他形状标记曲线的交叉点,并对其标记符号进行颜色的填充,区分边缘颜色
你好,仅供参考
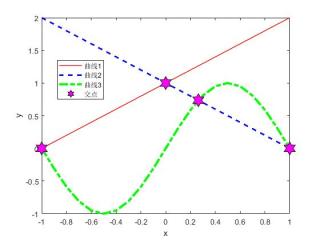
y1 = x + 1;
y2 = -x+1;
y3 = sin(pi*x);
plot(x,y1,'r-', 'linewidth',1); hold on
plot(x,y2,'b--', 'linewidth',2)
plot(x,y3,'g-.', 'linewidth',3)
plot([0.263515551758265,1,-1,0],[0.736484448241735,0,0,1],...
    'h','markerfacecolor','m','markeredgecolor','k',...
    'markersize',17)
legend('曲线1','曲线2','曲线3','交点')
axis([-1,1,-1,2])
xlabel('x')
ylabel('y')