MATLAB EMD分解结果和显示有差别
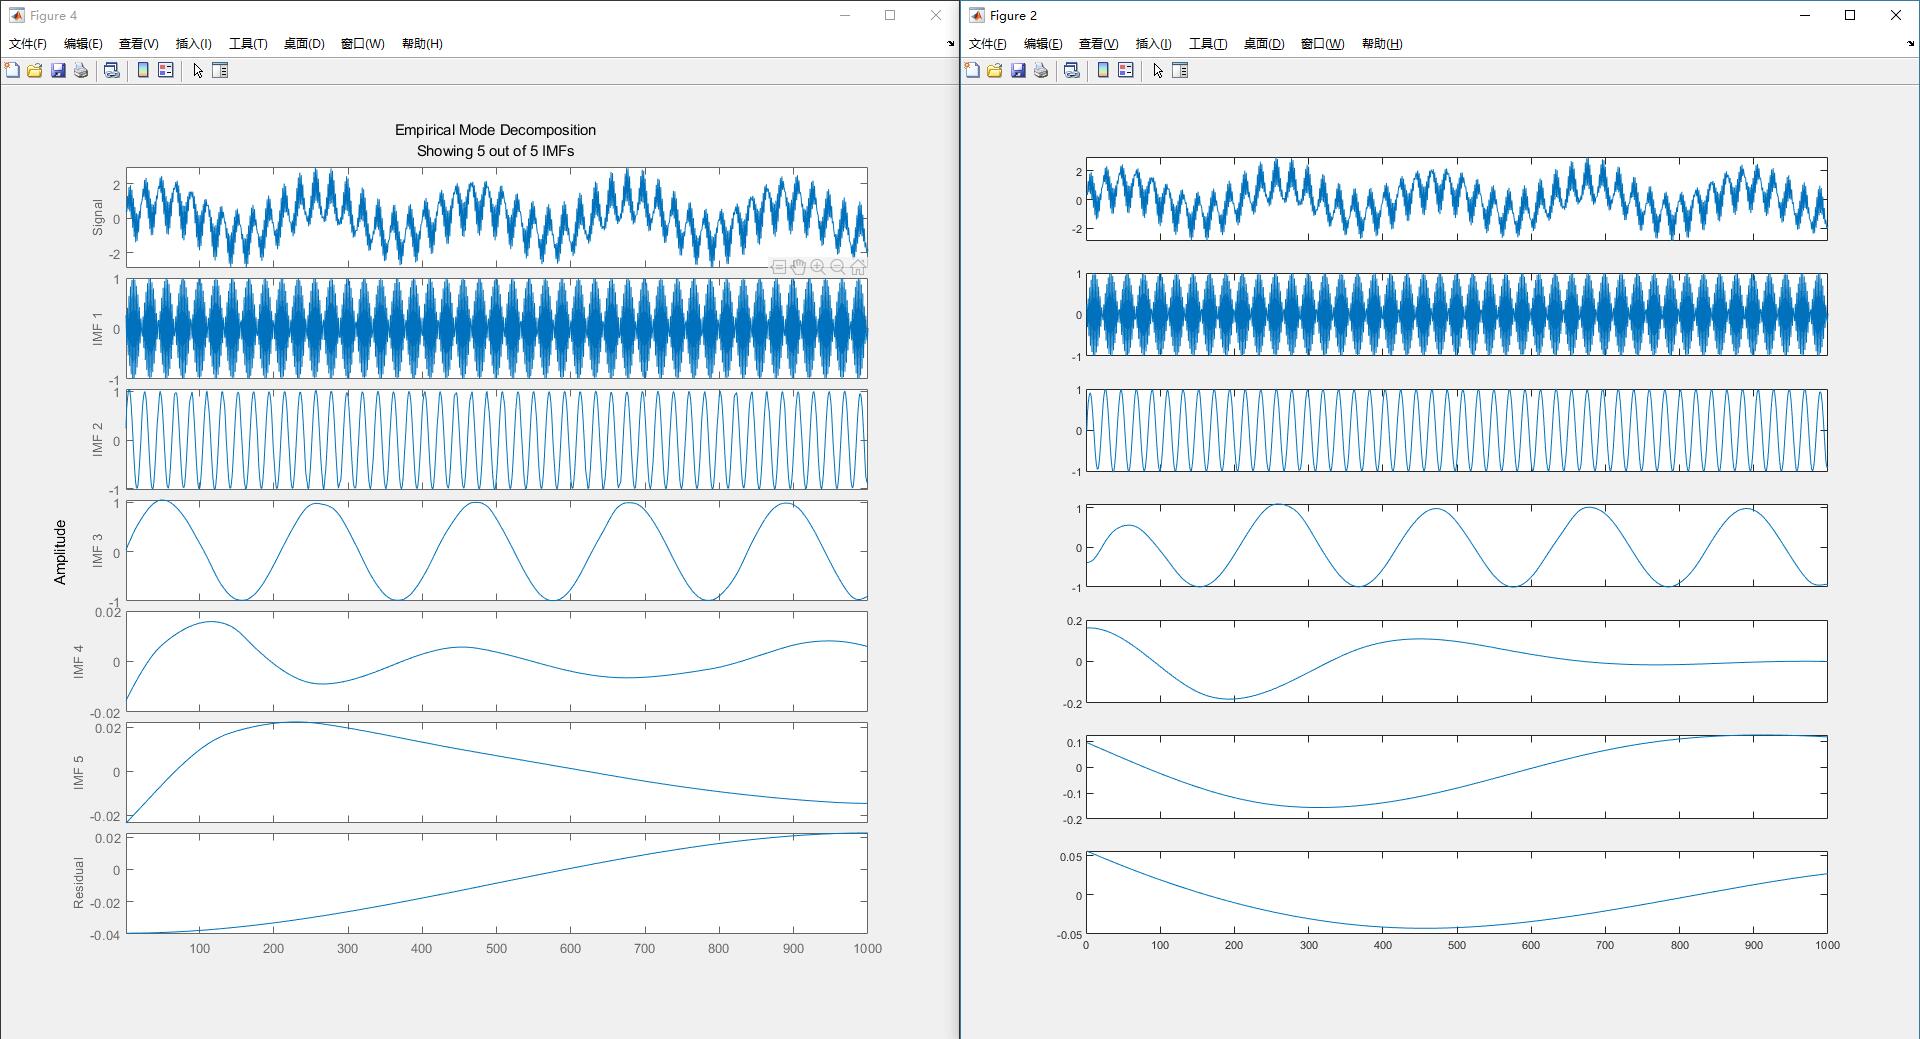
为什么emd函数输出的结果和运行emd时显示的经验模态图不一样?左图是运行时显示的图,显示了原信号和5个经验模态图以及余项。右图是根据输出数据画的图,可以明显看出IMF3和原图不一样,请问这是为什么?
代码如下:
clc;clear
x=load('sumsin');
x=x.sumsin;
t=1:length(x);
[output,res]=emd(x);
emd(x,'Interpolation','pchip');          % 此时输出左图

figure
subplot(711)
plot(t,x)
set(gca,'xticklabel','');
for i=1:6
    subplot(7,1,i+1)
    plot(t,imf(:,i))
    if i<6;set(gca,'xticklabel','');end
end                                     % 此时输出右图
[output,res]=emd(x);
emd(x,'Interpolation','pchip');          % 此时输出左图
你的这句重复啦,明显的BUG!,emd默认‘Interpolation’是‘spline’,你显示的图示‘spline’的而不是‘pchip’,而存取的变量是‘pchip’的结果!
emd函数前没有output arguments 时输出图片,若有输出变量则不会显示图片。
就是说 emd(x,'Interpolation','pchip'); 改成emd(x,'Interpolation','spline'); ?