python数据可视化包 seaborn显示柱状图比例
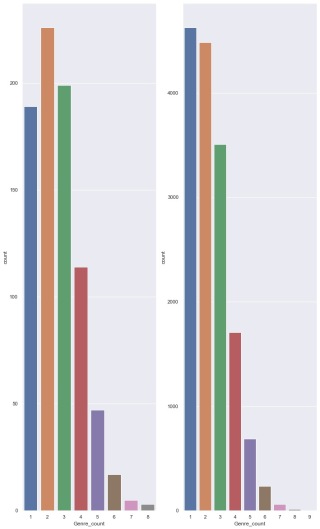
French_movie_genre_count = French_movies['Genre_count']
non_French_movies_genre_count = non_French_movies['Genre_count']
fig, ax = plt.subplots(1,2)
sns.set(rc={'figure.figsize':(11.7,10.7)})
sns.countplot(x = French_movie_genre_count, ax = ax[0])
sns.countplot(x = non_French_movies_genre_count, ax=ax[1])
fig.show()
如何在countplot上添加百分比?
还有我觉得图片大小不太合适 如何调整?
调整画布大小:
plt.figure(figsize=(15, 10))
添加百分比:这个里面有详细的说明
https://www.cnpython.com/qa/40130