首页
编程
java
php
前端
首页
编程
java
php
前端
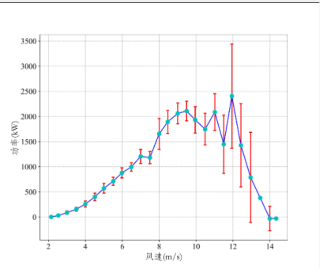
pyecharts可以画误差棒图吗?
这是我用matplotlib画的,
但是整体交互效果不太理想,现在有需要与pyecharts结合,需要用pyecharts画图,没找到方法?有没有做过类似功能的朋友
你可以看看官网有没有你想要的图
Examples - Apache ECharts
ECharts, a powerful, interactive charting and visualization library for browser
https://echarts.apache.org/examples/en/index.html#chart-type-line
如有帮助,请采纳哦~
点击展开全文