python DataFrame表头怎么设置背景颜色和字体颜色?
请问下怎么样可以设置DataFrame表头的背景颜色和字体颜色,然后导出来这些格式也是保留的,感谢~
比如这样的表格,我想把表头设置为蓝色,表头的字体颜色设置为白色

众所周知,改变样式的目的是使最终用户的可读性更强。我们可以更改数据的颜色和格式,以便更有效地传达想法。通常,对于在DataFrame上更直观的可视化,我们使用DataFrame.style属性,该属性返回样式器对象,该对象具有许多用于格式化和可视化数据框的有用方法。
使用DataFrame.style属性
- df.style.set_properties: 通过使用此功能,我们可以使用内置功能来处理从字体颜色到背景颜色的数据框样式。
import pandas as pd
import numpy as np
# Seeding random data from numpy
np.random.seed(24)
# Making the DatFrame
df = pd.DataFrame({'A': np.linspace(1, 10, 10)})
df = pd.concat([df, pd.DataFrame(np.random.randn(10, 4),
columns=list('BCDE'))], axis=1)
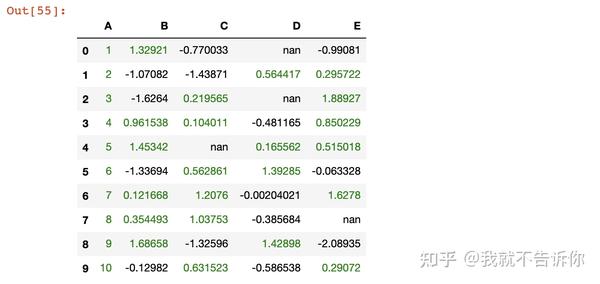
# DataFrame without any styling
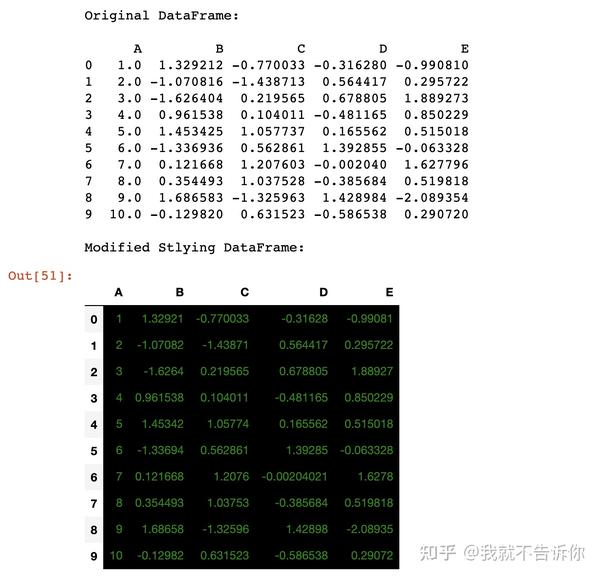
print("Original DataFrame:\n")
print(df)
print("\nModified Stlying DataFrame:")
df.style.set_properties(**{'background-color': 'black',
'color': 'green'})
df.style.set_properties
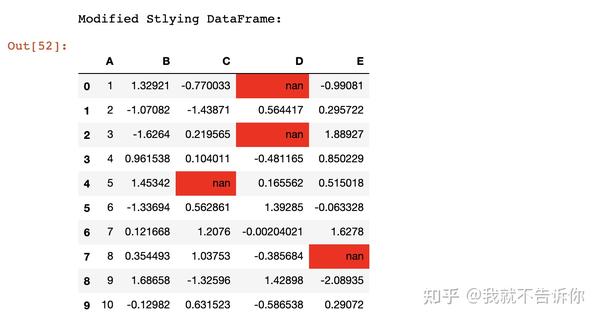
- df.style.highlight_null: 在此帮助下,我们可以突出显示数据框内丢失或为空的值。
df.iloc[0, 3] = np.nan
df.iloc[2, 3] = np.nan
df.iloc[4, 2] = np.nan
df.iloc[7, 4] = np.nan

# Highlight the NaN values in DataFrame
print("\nModified Stlying DataFrame:")
df.style.highlight_null(null_color='red')
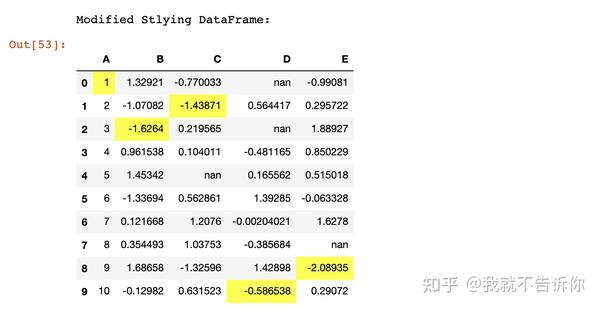
- df.style.highlight_min: 用于突出显示整个数据帧中每一列的最小值。
print("\nModified Stlying DataFrame:")
df.style.highlight_min(axis=0)
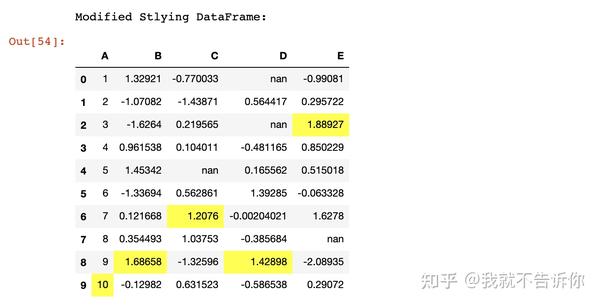
- df.style.highlight_max: 用于突出显示整个数据帧中每一列的最大值。
# Highlight the Max values in each column
print("\nModified Stlying DataFrame:")
df.style.highlight_max(axis=0)
使用用户定义的功能
- 我们可以使用用户定义的函数来修改DataFrame: 在此函数的帮助下,我们可以自定义数据框内正数据值的字体颜色。
# function for set text color of positive
# values in Dataframes
def color_positive_green(val):
    """
    Takes a scalar and returns a string with
    the css property `'color: green'` for positive
    strings, black otherwise.
    """
    if val > 0:
        color = 'green'
    else:
        color = 'black'
    return 'color: %s' % color

df.style.applymap(color_positive_green)
使用Seaborn库
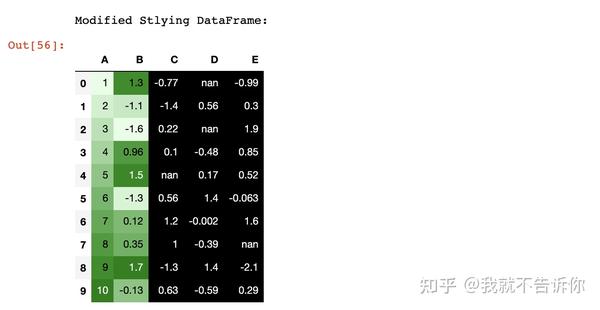
- 将调色板用于渐变填充到DataFrame中: 通过从seaborn库中导入颜色的调色板,我们可以映射数据框背景的颜色渐变。
# Import seaborn library
import seaborn as sns

# Declaring the cm variable by the
# color palette from seaborn
cm = sns.light_palette("green", as_cmap=True)

# Visualizing the DataFrame with set precision
print("\nModified Stlying DataFrame:")
df.style.background_gradient(cmap=cm).set_precision(2)
- 使用突出显示空值或缺失值的调色板: 在这里,我们用Seaborn的渐变调色板突出显示红色的NaN值。
# Highlight the NaN values in DataFrame
# using seaborn color palette
print("\nModified Stlying DataFrame:")
df.style.background_gradient(cmap=cm).set_precision(2).highlight_null('red')

- 将Seaborn属性与DataFrame.style属性组装在一起: 使用数据框的高亮属性自定义seaborn调色板,以实现更具影响力的数据可视化。
# Highlight the NaN values in DataFrame
# using seaborn color palette as well as
# min('lighblue') and max('blue') values
# in each column
print("\nModified Stlying DataFrame:")
df.style.background_gradient(cmap=cm).set_precision(2).highlight_null('red').highlight_min(axis=0, color='lightblue').highlight_max(axis=0, color='blue')