怎么用Python语言确定函数单调区间并画图
1,确定函数f( x)= x³-3x的单调区间,求解同时要画图
2,确定函数2x³-6x²-18x+7的极值,求解同时要画图
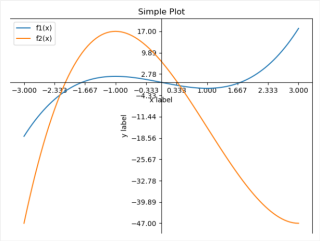
f1(x) = x(x²-3) -无穷大-√3,√3+无穷大单调递增 -√3~√3单调递减
f2(x) = 2x³-6x²-18x+7 = 2x(x²-3x-9)+7 = 2x(x-√3/2)²-9.75)+7 极值如图17,控制台也有输出
图表如图:
# 1. 确定函数f( x)= x³-3x的单调区间,求解同时要画图
# 2. 确定函数2x³-6x²-18x+7的极值,求解同时要画图

# f1(x) = x(x²-3)  -无穷大~-√3,√3~+无穷大单调递增  -√3~√3单调递减
# f2(x) = 2x³-6x²-18x+7 = 2x(x²-3x-9)+7 = 2x(x-√3/2)²-9.75)+7
import matplotlib.pyplot as plt
import numpy as np

x = np.linspace(-3, 3, 100)

fig, ax = plt.subplots()  # 创建一个图标和轴

y1 = x ** 3 - 3 * x
y2 = 2 * x ** 3 - 6 * x ** 2 - 18 * x + 7

ax.plot(x, y1, label='f1(x)')
ax.plot(x, y2, label='f2(x)')

# 设置坐标轴原点
ax.spines['bottom'].set_position(('data', 0))  # 这个位置的括号要注意
ax.spines['left'].set_position(('data', 0))
ax.set_xlabel('x label')  # 添加x轴的标签
ax.set_ylabel('y label')  # 添加y轴的标签
ax.set_title("Simple Plot")  # 添加图表的标题

# 设置y轴刻度及范围
x_ticks = np.linspace(-3, 3, 10)
y_ticks = np.linspace(min(y2), max(y2), 10)
plt.xticks(x_ticks)
plt.yticks(y_ticks)
print('f2(x)的极值:', max(y2))
ax.legend()  # 添加说明
plt.show()
如有帮助,请采纳哦~