关于python可视化的问题
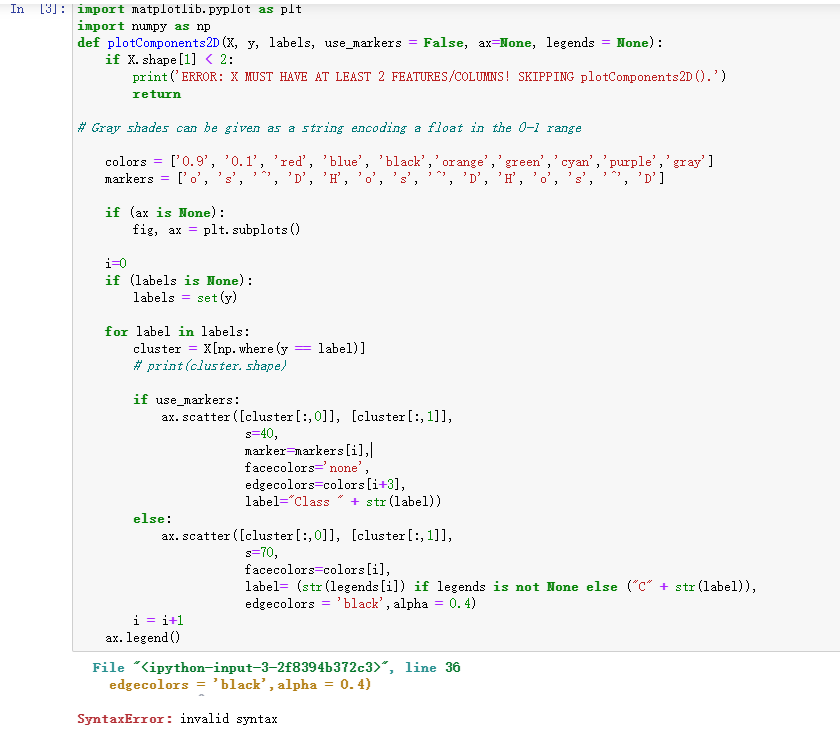
import matplotlib.pyplot as plt
import numpy as np
def plotComponents2D(X, y, labels, use_markers = False, ax=None, legends = None):
if X.shape[1] < 2:
print('ERROR: X MUST HAVE AT LEAST 2 FEATURES/COLUMNS! SKIPPING plotComponents2D().')
return
# Gray shades can be given as a string encoding a float in the 0-1 range
colors = ['0.9', '0.1', 'red', 'blue', 'black','orange','green','cyan','purple','gray']
markers = ['o', 's', '^', 'D', 'H', 'o', 's', '^', 'D', 'H', 'o', 's', '^', 'D']
if (ax is None):
fig, ax = plt.subplots()
i=0
if (labels is None):
labels = set(y)
for label in labels:
cluster = X[np.where(y == label)]
# print(cluster.shape)
if use_markers:
ax.scatter([cluster[:,0]], [cluster[:,1]],
s=40,
marker=markers[i],
facecolors='none',
edgecolors=colors[i+3],
label="Class " + str(label))
else:
ax.scatter([cluster[:,0]], [cluster[:,1]],
s=70,
facecolors=colors[i],
label= (str(legends[i]) if legends is not None else ("C" + str(label)),
edgecolors = 'black',alpha = 0.4)
i = i+1
ax.legend()


球球大佬!
