求大神用python面向对象的方法绘图
python面向对象设计绘图,没有什么太多要求,只要是张能看的图就行
https://blog.csdn.net/xiaobaicai4552/article/details/79064531
import matplotlib.pyplot as plt
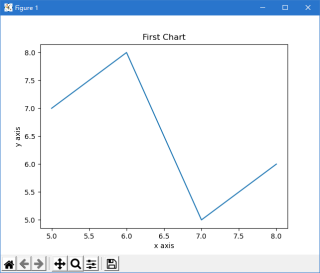
x = [5, 6, 7, 8]
y = [7, 8, 5, 6]
fig = plt.figure(1)
ax1 = fig.add_subplot(111)
ax1.plot(x,y)
ax1.set_title('First Chart')
ax1.set_xlabel('x axis')
ax1.set_ylabel('y axis')
#显示图像
plt.show()
参考下。如果对你有帮助,可以给我个采纳吗,谢谢!! 点击我这个回答右上方的【采纳】按钮
有帮助,请采纳,谢谢
###########第一部分:读取数据##############
import sys
sys.path.append(r"E:\python\project\python可视化\eda可视化项目\数据清洗与描述")
import data_and_clear
from datetime import datetime
df=data_and_clear.yd_department_day_sold()
#x轴转为日期格式
dates  = [str(y) for y in list(df['date'])]
x_date = [datetime.strptime(d, '%Y%m%d').date() for d in dates]


###########第二部分:matplotlib绘图##############

#设置显示中文
from pylab import *
import matplotlib
import matplotlib.pyplot as plt
import matplotlib.dates as mdates

#显示中文
matplotlib.rcParams['font.family'] = 'Microsoft JhengHei'
mpl.rcParams['font.sans-serif'] = ['Microsoft JhengHei']  #更新字体格式
mpl.rcParams['font.style'] = 'italic'
mpl.rcParams['font.size'] = 9                          #更新字体大小

#figure布局
fig=plt.figure(figsize=(8,4))
ax1=fig.add_subplot(1,1,1)

#绘图
ax1.plot(x_date,df['HC'],'--',color='b',marker='o',ms=4, mec='r',mew=2, mfc='w',label='业绩趋势走向')
plt.gcf().autofmt_xdate()  # 自动旋转日期标记

#配置坐标轴
#设置x轴为日期格式
plt.gca().xaxis.set_major_formatter(mdates.DateFormatter('%Y/%m/%d'))
plt.gca().xaxis.set_major_locator(mdates.DayLocator())

#去除部分边框和刻度线
ax1.spines['left'].set_color('none')
ax1.spines['right'].set_color('none')
ax1.spines['top'].set_color('none')
ax1.tick_params(labelleft=False,left=False,right=False,top=False)
ax1.tick_params(labelsize=9)

#设置坐标轴标签
plt.ylabel("销售额(万美元)",fontsize=11,color='b')

#标注数据
for xy in zip(x_date,df['HC']):                                 #标注数据
    plt.annotate("%0.02f" % round(xy[1]/10000,2), xy=xy, xytext=(2,12), textcoords='offset points',color='k',rotation=30)

#图像标题
ax1.set_title("业绩趋势走向图",fontsize=12)

#显示图像
plt.show()
用面向对象思想去做
import matplotlib.pyplot as plt

x = [1, 2, 3, 4]
y = [1.2, 2.5, 4.5, 7.3]

# plot函数作图
plt.plot(x, y)

# show函数展示出这个图,如果没有这行代码,则程序完成绘图,但看不到
plt.show() 
如果对你有帮助,可以点击我这个回答右上方的【采纳】按钮,给我个采纳吗,谢谢