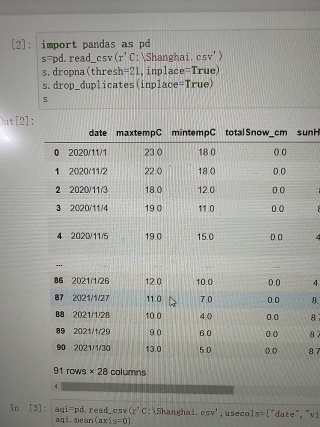
怎么引列画多折线点图,x轴是date,y轴是最高温最低温(前三列数据)
python使用matplotlib绘制折线图教程https://www.cnblogs.com/onemorepoint/p/7482644.html