如何理解Yahoo Streaming Benchmark运行结果seen.txt和updated.txt中值的含义
Yahoo! Streaming Benchmark简介
Yahoo! Streaming Benchmark是Yahoo的一个团队在2015年对当前热门的流式计算平台:Sparking Streaming, Storm和Flink开发的一个基准测试系统。
该系统是当时第一个将这三个流式计算平台在模拟真实应用场景下的基准测试,对后面的基准测试系统的发展有重要的意义。
该系统详细的介绍见:https://yahooeng.tumblr.com/post/135321837876/benchmarking-streaming-computation-engines-at。
Github地址:https://github.com/yahoo/streaming-benchmarks。
问题描述
在使用该基准测试系统进行运行之后,会产生两个结果文件:seen.txt,updated.txt。其中记录的相关的测试结果信息,但对这两个文件中数据的含义存在困惑。相似的问题在Github中仍存在,但无人解答:https://github.com/yahoo/streaming-benchmarks/issues/22。
因此,如何理解这个基准测试的信息,并且如何使用这些数据绘制出如下统计图(该图是该系统开发人员进行给出的):
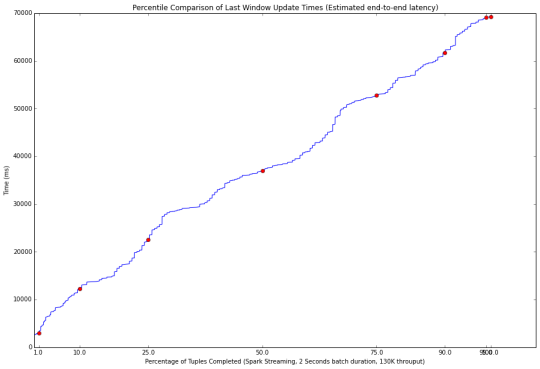
感谢你的回答!!!
计算latency主要使用updated.txt 其存的是10s窗口生成的最后一条数据被处理的时间(last_record_timestamp)与10s窗口第一条数据产生的时间(所说的window产生时间window_time)之差。最终计算latency时还要减去窗口时间(10s),表示数据产生窗口的最后一条record从kafka发出到被处理的时间。 希望对你有所帮助!
感谢你的回答。updated.txt文件中存的是10s时间窗口中的最后一条数据和第一条数据的时间之差,这个我能理解。但注意到整个数据产生的时候,是包含100个campaign,每个campaign包含10个ads。然后对每个ad-event进行发送。在拓扑其后的过程中,根据每个ad event对应的campaign__id进行了分组统计。这样的话,其实是不是应该包含两个统计窗口,第一个就是10s的时间窗口,第二个为campaign的窗口。这样的话,对于seen.txt和updated.txt文件中的结果。是否应该理解为如下的格式:
 // the first time window
Campaign1 -> time window1 -> the event count of the campaign1 in time window1
Campaign2 -> time window1 -> the event count of the campaign2 in time window1
Campaign3 -> time window1 -> the event count of the campaign3 in time window1
       … …
Campaign100 -> time window1 -> the event count of the campaign100 in time window1
// the second time window
Campaign1 -> time window2 -> the event count of the campaign1 in time window2
Campaign2 -> time window2 -> the event count of the campaign2 in time window2
Campaign3 -> time window2 -> the event count of the campaign3 in time window2
       … …
Campaign100 -> time window2 -> the event count of the campaign100 in time window2
…
// the final time window (If the TEST_TIME was set T, then the N=T/10s)
Campaign1 -> time windowN -> the event count of the campaign1 in time windowN
Campaign2 -> time windowN -> the event count of the campaign2 in time windowN
Campaign3 -> time windowN -> the event count of the campaign3 in time windowN
       … …
Campaign100 -> time windowN -> the event count of the campaign100 in time windowN
updated.txt中的结果理解:
// the first data in updated.txt
Latency1 = the last updated time (the last event of the event that belongs to campaign1 in time window1) – the start time from Kafka.
// the second data in updated.txt
Latency2 = the last updated time (the last event of the event that belongs to campaign2 in time window1) – the start time from Kafka.
       …
Latency100 = the last updated time (the last event of the event that belongs to campaign100 in time window1) – the start time from Kafka.
       …
LatencyM = the last updated time (the last event of the event that belongs to campaign100 in time windowN) – the start time from Kafka.
而且,根据运行测试结果,在运行了30min的时间时,理论上10s的时间窗口应该为180个。但这两个文件中的数据行数约为18000。因此我感觉是应该有两个窗口在统计,一个是10s的时间窗口,_另一个是campaign_id为标识的campaign窗口。这是我的理解。_