用Python的Matplotlib绘制2D图像, 如何把输入数学公式也变成衬线字体?
我用
rcParams['font.family'] = 'serif'
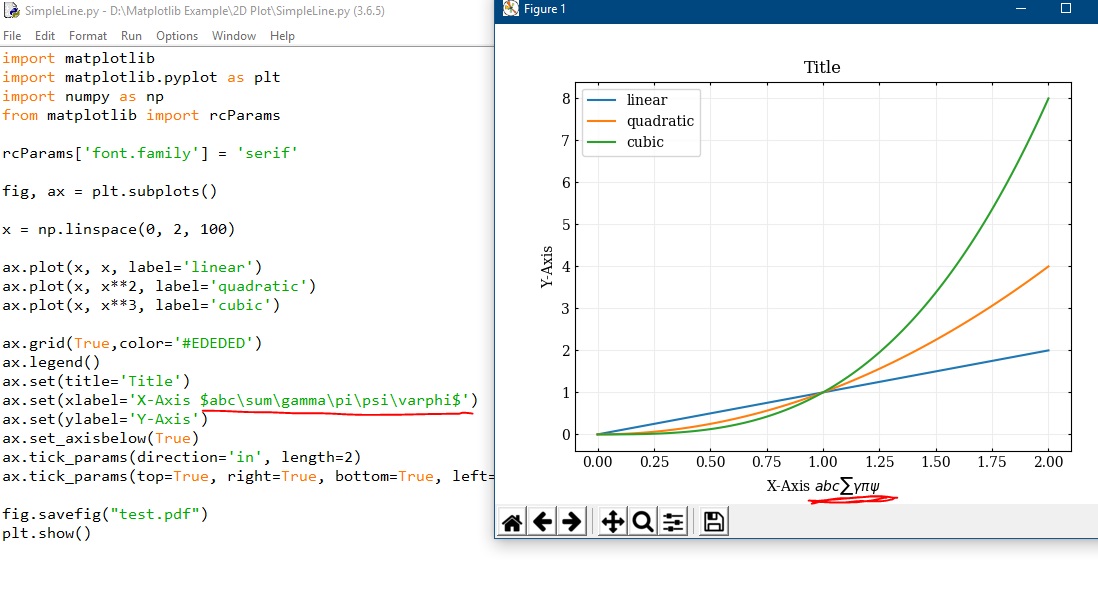
命令把原来图中默认的无衬线字体换成了, 衬线字体, 但是在两个 $ 符号里面的数学公式仍然是非衬线字体, 如何把输入数学公式也变成衬线字体? 不想调用 LaTeX, 因为这样画图花费的时间会很长...
import matplotlib
import matplotlib.pyplot as plt
import numpy as np
from matplotlib import rcParams

rcParams['font.family'] = 'serif'

fig, ax = plt.subplots()

x = np.linspace(0, 2, 100)

ax.plot(x, x, label='linear')
ax.plot(x, x**2, label='quadratic')
ax.plot(x, x**3, label='cubic')

ax.grid(True,color='#EDEDED')
ax.legend()
ax.set(title='Title')
ax.set(xlabel='X-Axis $abc\sum\gamma\pi\psi\varphi$')
ax.set(ylabel='Y-Axis')
ax.set_axisbelow(True)
ax.tick_params(direction='in', length=2)
ax.tick_params(top=True, right=True, bottom=True, left=True)

fig.savefig("test.pdf")
plt.show()
https://matplotlib.org/stable/tutorials/text/usetex.html
设置 plt.rcParams["text.usetex"] = True 即可
但好像渲染时会比较慢
请问楼主解决了吗,我也碰到了一样的问题