Highcharts横坐标问题
 代码如下:
代码如下:
$('#charts1').highcharts({
colors: ["#d9534f", "#5c90d2"],
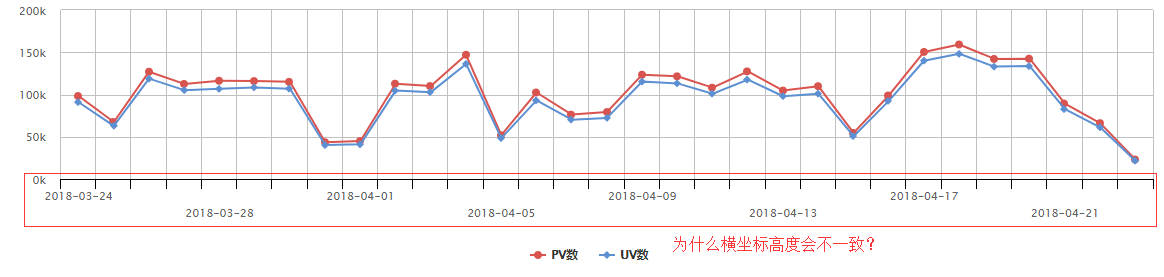
title: { text: '7x24快讯近30日总PV、UV趋势' },
subtitle: { text: '' },
xAxis: {
gridLineWidth: 1,
lineColor: '#000',
tickColor: '#000',
categories: days,
labels: {
step: 4
}
},
yAxis: {
title: {
text: ''
}
},
tooltip: {
valueSuffix: ''
},
credits: {
enabled: false
},
series: [{
name: 'PV数',
data: pvs
}, {
name: 'UV数',
data: uvs
}]
});
都是默认的,不知道为什么会高度不一致。使用c#运行高度是一致的。
xAxis: {
categories: ['北京', '哈尔滨', '青岛', '天津', '上海', '杭州','南京', '广州', '深圳', '香港', '昆明', '成都'],
labels:{
y:30,//向下离坐标轴30px,可以自己调整
style: {
writingMode : 'tb-rl'//文字竖排样式,
}
}
},
categories: ['北京', '哈尔滨', '青岛', '天津', '上海', '杭州','南京', '广州', '深圳', '香港', '昆明', '成都'],
labels:{
y:30,//向下离坐标轴30px,可以自己调整
style: {
writingMode : 'tb-rl'//文字竖排样式,
我已经找到问题所在,是字体太大,但是我看这个x横坐标之间间距足够大啊