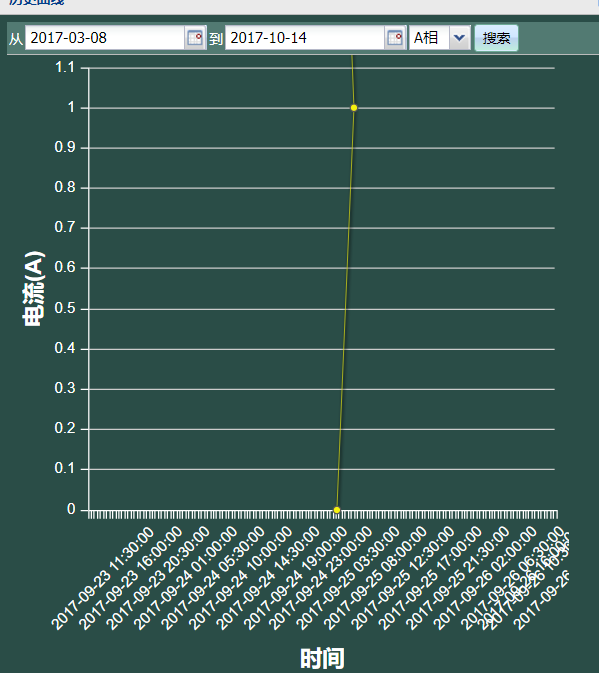
求助!为什么我做的曲线是这个样子的,搞不懂啊
 function constructSWHisChart() {
        var chart_his = Ext.create('Ext.chart.Chart', {
            renderTo: Ext.getBody(),
            store: store_sw_curve,
            width: 450,
            height: 500,
            axes: [{
                title: '水位(m)',
                type: 'Numeric',
                position: 'left',
                fields: ['value_STR'],
                minimum: 0,
                grid:true
            }, {
                title: '时间',
                type: 'Time',
                position: 'bottom',
                label:{
                  rotate:{
                      degrees:-45
                  }
                },

                step: [Ext.Date.MINUTE, 30],    //时间轴,坐标点,步进距离
                dateFormat: 'Y-m-d H:i:s',
                groupBy: 'year,month,day,hour,minute,second',
                aggregateOp: 'sum',

                fields: ['time']
            }],
            series: [{
                type: 'line',
                axis: 'left',
                highlight: {
                    size: 7,
                    radius: 7
                },
                xField: 'time',
                yField: 'value_STR'
            }]
        });
        var chart_panel = Ext.getCmp('chart_panel_sw_his');
        chart_panel.removeAll();
        chart_panel.add(chart_his);
}
'value_STR'这个值没有被画出来,是不是这块有问题?