var storeabc = Ext.create('Ext.data.Store', {
model: 'WeatherPoint',
data: [
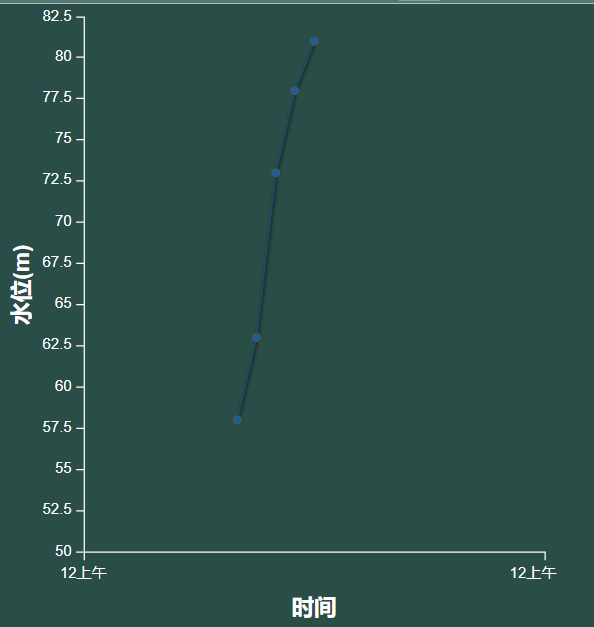
{ temperature: 58, date: new Date(2011, 1, 1, 8) },
{ temperature: 63, date: new Date(2011, 1, 1, 9) },
{ temperature: 73, date: new Date(2011, 1, 1, 10) },
{ temperature: 78, date: new Date(2011, 1, 1, 11) },
{ temperature: 81, date: new Date(2011, 1, 1, 12) }
]
});
function constructSWHisChart() {
var chart_his = Ext.create('Ext.chart.Chart', {
renderTo: Ext.getBody(),
store: storeabc,
width: 450,
height: 500,
axes: [{
title: '水位(m)',
type: 'Numeric',
position: 'left',
fields: ['temperature']
// grid:true
}, {
title: '时间',
type: 'Time',
position: 'bottom',
fields: ['date'],
groupBy: 'hour',
dateFormat: 'ga'
}],
series: [{
type: 'line',
highlight: {
size: 7,
radius: 7
},
axis: 'left',
xField: 'date',
yField: 'temperature'
}]
});
var chart_panel = Ext.getCmp('chart_panel_sw_his');
chart_panel.removeAll();
chart_panel.add(chart_his);
}