解决问题马上微信10元红包,在线急等,留下您的微信号
EXTJS 4 ,折线图
最近公司要弄个折线图,想要对折现点的颜色根据data的值不同进行渲染颜色
 Ext.define("eqmanaly.view.OneLineChart", {
     extend : "Ext.chart.Chart",
     alias  : "widget.OneLineChart",
     store  : "eqmanaly.store.OneLineChart",
     animate:true,
     width  :400,
     style: 'background:#fff',
//   theme: 'Category1',
     shadow: true,
     legend : {
            position: 'top'
     },
     axes:[
        {
        type:'Numeric',
        fields:['percent','upperlimit','lowerlimit'],
        title:'设备尺寸检测',
        position:'left',
        minimum:0 ,
        grid: {
                odd: {
                    opacity: 1,
                    stroke: '#bbb',
                    'stroke-width': 0.5
                }
            }
         },{
            type:'Category',
            position:'bottom',
            fields:['number'],
            title:'日期',
            grid:true,
            label:{
                rotate:{degrees:315}
            }
         }],
     series:[{
        axis:'left',
        type:'line',
        xField:['number'],
        yField:['upperlimit'],
        title:'最大值',
        highlight: true,
        style:{
            fill: '#6600FF',
            opacity:0.5
        },
        tips: {
            trackMouse: true,
            width: 65,
            height: 28,
            renderer: function(storeItem, item) {
                this.setTitle(String(storeItem.get('upperlimit')) );
            }
        },
        markerConfig: {
            type: 'circle',
            size: 1,
            radius: 1,
            'stroke-width': 0
        }

    },
    {
        axis:'left',
        type:'line',
        xField:['number'],
        yField:['lowerlimit'],
        title:'最小值',
        highlight: true,
        style:{opacity:.5},
        tips: {
            trackMouse: true,
            width: 65,
            height: 28,
            renderer: function(storeItem, item) {
                this.setTitle(String(storeItem.get('lowerlimit')) );
            }
        },
        markerConfig: {
            type: 'circle',
            size: 1,
            radius: 1,
            'stroke-width': 0
        }

    },
        {
        axis:'left',
        type:'line',
        xField:['number'],
        yField:['percent'],
        title:'实际尺寸',
        highlight: true,
        style:{opacity:.5},
        tips: {
            trackMouse: true,
            width: 65,
            height: 28,
            renderer: function(storeItem, item) {
                this.setTitle(String(storeItem.get('percent')) );
            }
        },
        markerConfig: {
            type: 'circle',
            size: 4,
            radius: 4,
            'stroke-width': 0
        },

        renderer : function(sprite, storeItem, barAttr, i, store) {
//           var colors = ['rgb(212, 40, 40)'];
            var percent = 0;
            for (var dd in storeItem.data){
                if(dd == "percent"){
                percent = storeItem.data[dd];
                }
            }
            if( parseFloat("2.995")< parseFloat(percent) && parseFloat(percent)<parseFloat("3.105")){
//              return Ext.apply(barAttr, { fill: 'rgb(255, 68, 186)' });
                 barAttr.fill = 'rgb(255, 68, 186)';
            }else {
//              return Ext.apply(barAttr, { fill: 'rgb(25, 68, 186)' });
                barAttr.fill = 'rgb(25, 68, 186)';
            }
            return barAttr

        }


    }]
});
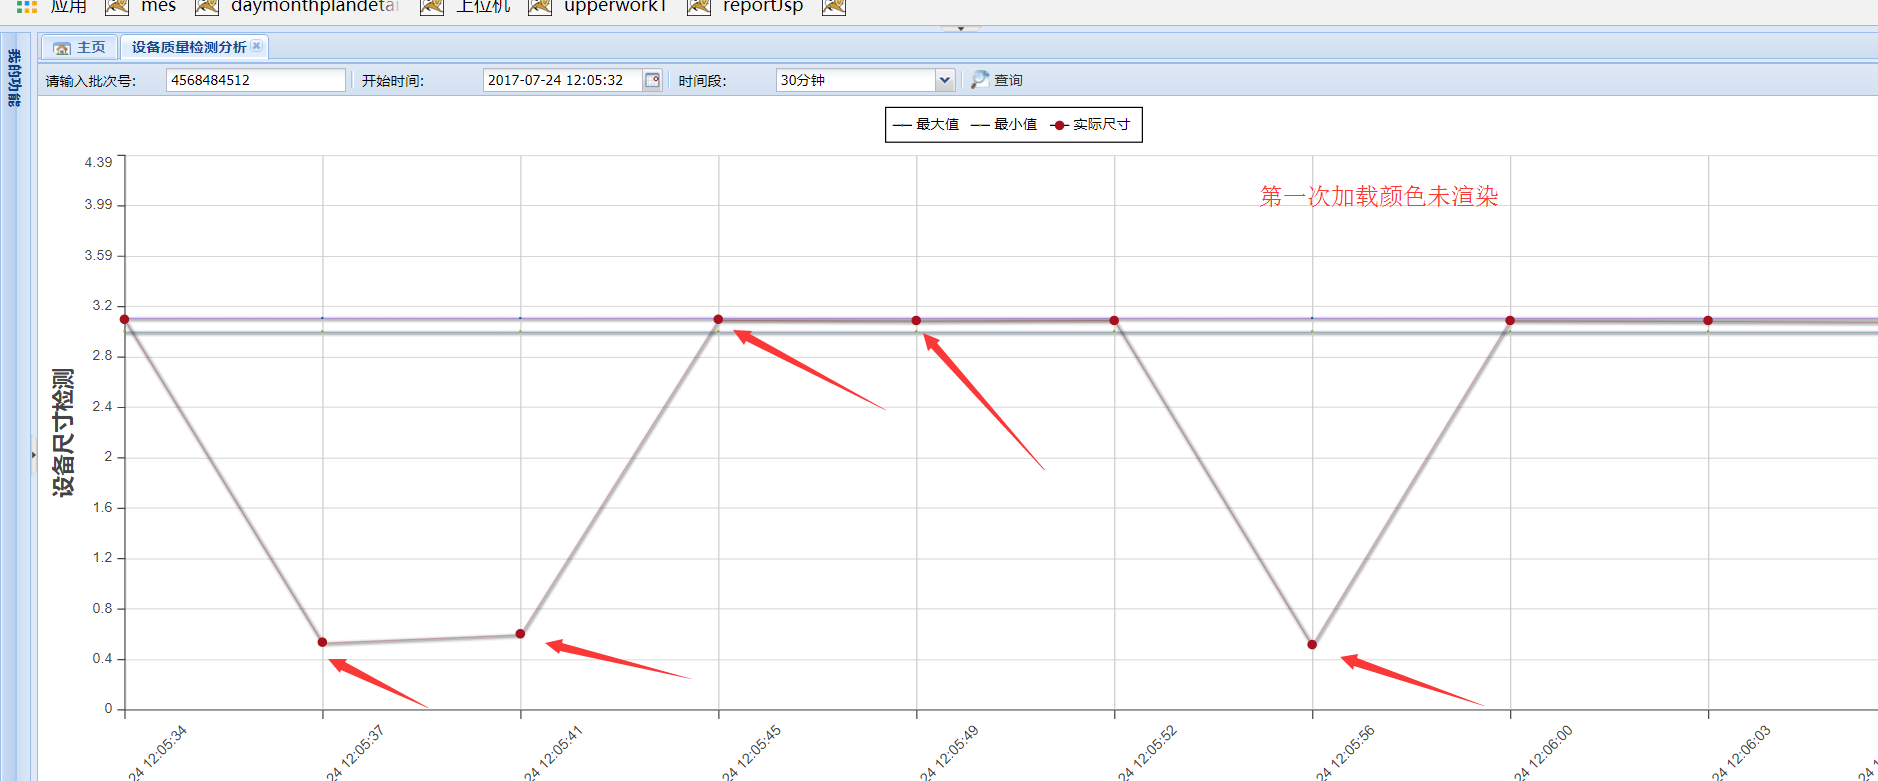
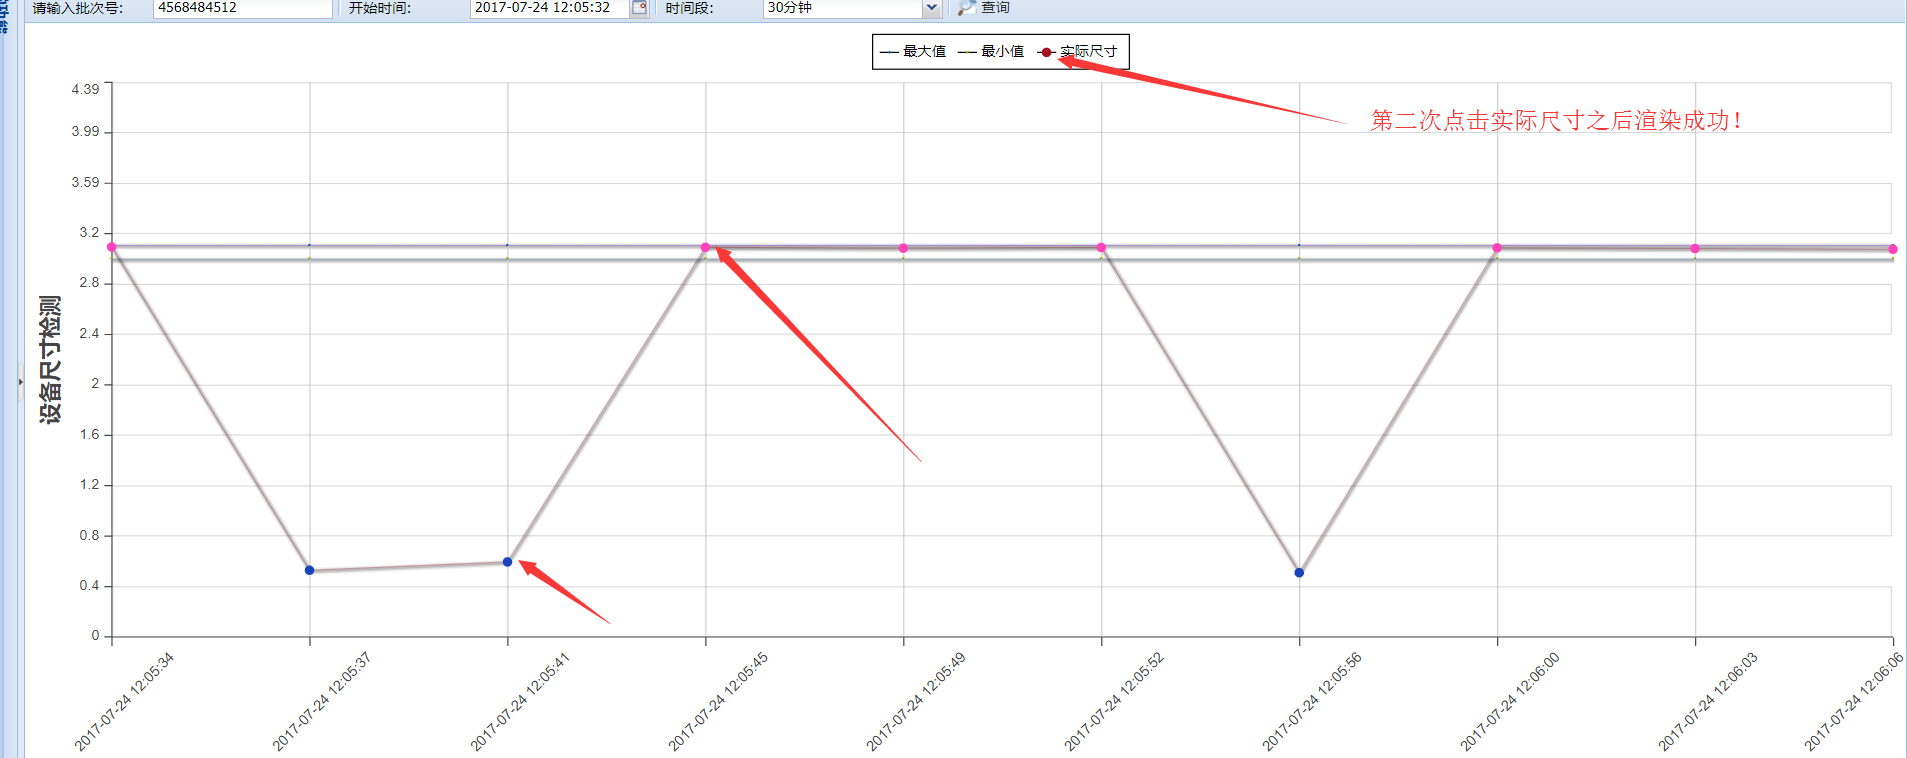
求:如何才能让第一次加载store的时候就渲染点成功
ext-4.2.1.883测试你的代码没问题,4.1-之前的测试没效果。。
在线等,解决之后马上转微信红包!谢谢
很遗憾,extjs框架没用过,但是看结构 颜色应该是在series里改动,series里的 style:{fill: '#6600FF',opacity:0.5},应该就是设置颜色的吧? fill属性很像echarts的color属性。echarts里的color属性是可以写动态值的,fill应该不应该只能写死值,应该能写个方法返回值;
下面是echarts的例子:
 function(params) {
                            if(params.value<15){
                                return new echarts.graphic.LinearGradient(0, 0, 0, 1, [{
                                    offset: 0,
                                    color: 'rgba(74, 209,70, 1)'
                                }, {
                                    offset: 1,
                                    color: 'rgba(74, 209,70, 0.1)'
                                }]);
                            }
                                                }
                                                。。。。
                    }
例子不全...仅表达意思,
extjs的fill也应该有类似功能 ,方法return的就可以写具体颜色了 比如“#6600FF”,我这里是echarts的颜色渐变效果。
--------------如果楼主还没解决,希望这对你有帮助(*^__^*) ……------------------------------------------
前几年这个东西比较火,现在用到的估计都是很老的项目了吧,哈哈哈,兄弟保重
依然在线上。。求具体一点的解决方案或者思路
准备回家,8点之后在线等