echarts 多个仪表盘位置怎么设置
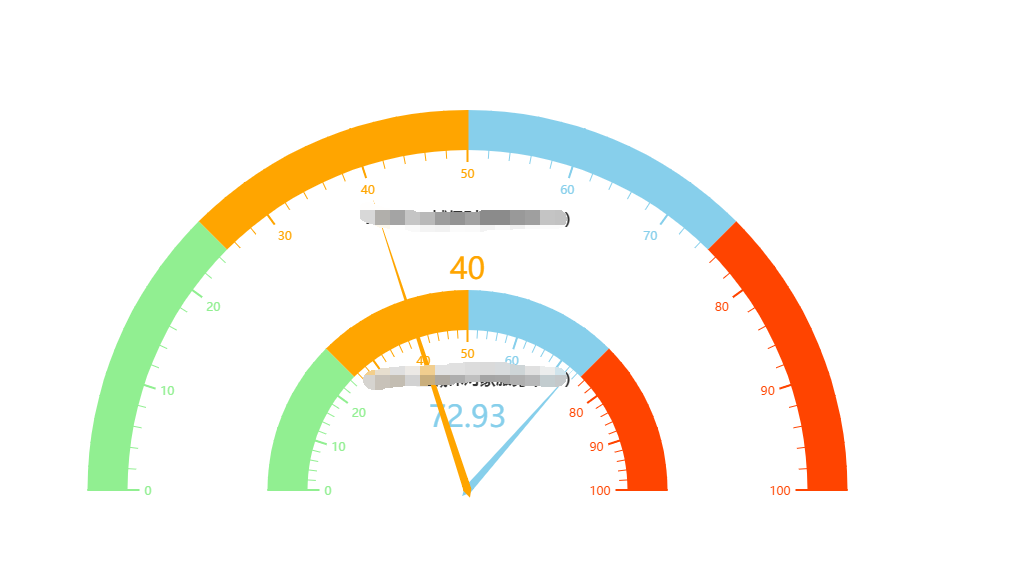
求教!怎么实现图中的仪表盘
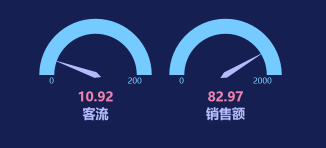
利用center属性,例子:
  var myChart = echarts.init(document.getElementById('rateDash'));
            option = {
                tooltip: {
                    formatter: "{a} <br/>{b} : {c}%"
                },
                toolbox: {
                    feature: {
                        restore: {},
                        saveAsImage: {}
                    },
                    show: false
                },
                series: [
                    {
                        startAngle: 180, //开始角度 左侧角度
                        endAngle: 0, //结束角度 右侧
                        type: 'gauge',
                        center: ['15%', '50%'], //**调整仪表盘的位置**
                        detail: {
                            formatter: '{value}',
                            color: '#ee83af',
                            fontSize: 26,
                            fontWeight: 'bolder'
                        },
                        axisLine: {
                                lineStyle: {
                                         color: [[1, '#75caff']]
                                }
                        },
                        itemStyle: { color:'#b6bcfb' },
                        splitLine:{ show: false },
                        axisTick: { show: false },
                        axisLabel: {
                            show: true,
                            fontSize: 16,
                            distance: -10,
                            padding: [24, 0, 0, 0],
                            formatter: function (value) {
                                switch (value) {
                                    case 0:
                                        return 0;//首位刻度
                                    case 100:
                                        return 200;//末尾刻度
                                    default: return '';
                                }
                            }
                        } ,
                        pointer: { width: 6 },
                        data: [{ value: 50, name: '客流'}],
                        title: {
                            show: true,
                            offsetCenter: [0, '70%'],
                            textStyle: {
                                fontWeight: 'bolder',
                                fontSize: 26,
                                color: '#b6bcfb'
                            }
                        }
                    },
                    {
                        startAngle: 180, //开始角度 左侧角度
                        endAngle: 0, //结束角度 右侧
                        type: 'gauge',
                        center: ['35%', '50%'], //**调整仪表盘的位置**
                        detail: {
                            formatter: '{value}',
                            color: '#ee83af',
                            fontSize: 26,
                            fontWeight: 'bolder'
                        },
                        axisLine: {
                            lineStyle: {
                                color: [[1, '#75caff']]
                            }
                        },
                        itemStyle: { color: '#b6bcfb' },
                        splitLine: { show: false },
                        axisTick: { show: false },
                        axisLabel: {
                            show: true,
                            fontSize: 16,
                            distance: -10,
                            padding: [24, 0, 0, 0],
                            formatter: function (value) {
                                switch (value) {
                                    case 0:
                                        return 0;//首位刻度
                                    case 100:
                                        return 2000;//末尾刻度
                                    default: return '';
                                }
                            }
                        },
                        pointer: { width: 6 },
                        data: [{ value: 800, name: '销售额' }],
                        title: {
                            show: true,
                            offsetCenter: [0, '70%'],
                            textStyle: {
                                fontWeight: 'bolder',
                                fontSize: 26,
                                color: '#b6bcfb'
                            }
                        }
                    }
                ]
            };

            setInterval(function () {
                option.series[0].data[0].value = (Math.random() * 100).toFixed(2) - 0;
                option.series[1].data[0].value = (Math.random() * 100).toFixed(2) - 0;
                myChart.setOption(option, true);
            }, 2000);

            myChart.setOption(option, true);