HighCharts导出图片显示不全怎么办
网页上是这样的: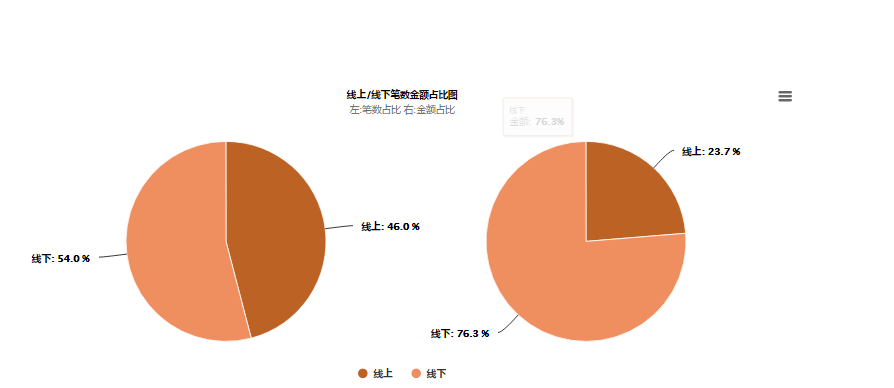
导出之后就变成这样了,缺失了右半边,调节 width也不好使,请问是为什么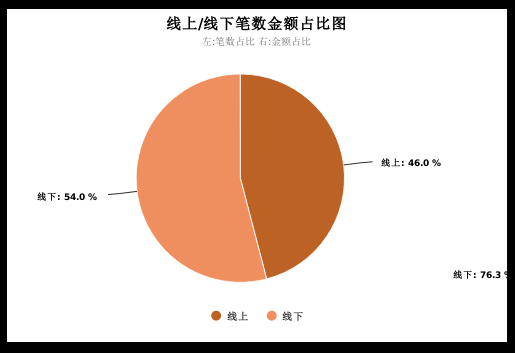
HTML:
<div id="container" style="min-width: 310px;height: 400px;max-width: 1000px;margin: 100 auto"></div>

js:
$(function () {
        Highcharts.setOptions({
            lang: {
                printChart: '打印图表',
                downloadJPEG: '下载 JPEG 文件',
                downloadPDF: '下载 PDF  文件',
                downloadPNG: '下载 PNG  文件',
                downloadSVG: '下载 SVG  文件',
                downloadCSV: '下载 CSV  文件',
                downloadXLS: '下载 XLS  文件'
            },
            navigation: {
                menuItemStyle: {
                    padding: '6px 14px'
                }
            },

        });
        chart = new Highcharts.Chart({
            chart: {
                renderTo: 'container',
                type:'pie',
                plotBackgroundColor: null,
                plotBorderWidth: null,
                plotShadow: false
            },
            exporting: {
                width:500,
                heigh:500,
                url: 'https://export.highcharts.com.cn'
            },
            colors: [
                '#bd6225',
                '#ef8f60'
            ],
            title: {
                text: '线上/线下笔数金额占比图',
                style: {
                    color: '#000000',
                    fontWeight: 'bold',
                    fontSize: "18px"
                }
            },
            subtitle: {
                text: '左:笔数占比 右:金额占比'
            },
            tooltip: {
                pointFormat: '{series.name}: <b>{point.percentage:.1f}%</b>'
            },
            plotOptions: {
                pie: {
                    allowPointSelect: true,
                    cursor: 'pointer',
                }
            },
            series: [{
                type: 'pie',
                name: '笔数',
                center:[250,null],
                size:250,
                dataLabels: {
                    enabled: true,
                    color: '#000000',
                    connectorColor: '#000000',
                    format: '<b>{point.name}</b>: {point.percentage:.1f} %',
                    step:1
                },
                showInLegend: false,

            },{
                type: 'pie',
                name: '金额',
                center:[700,null],
                size:250,
                dataLabels: {
                    enabled: true,
                    color: '#000000',
                    connectorColor: '#000000',
                    format: '<b>{point.name}</b>: {point.percentage:.1f} %',
                    step:1
                },
                showInLegend: true,
            }],
            credits : { //去除右下角标示
                enabled : false
            }
        });
        linePieChart();

    });
你这还是div的宽的问题,你并没有给div设置宽啊,只是给了最小最大的宽,可能你的分辨率低的原因吧