如何让canvasjs的生成的chart在现有前端框架漂亮显示?
现象:现有前端框架插入canvasjs的生成的chart后,显示效果不好
code:
    <div class="col-sm-12">
        <div class="widget-box">
            <div class="widget-header widget-header-flat widget-header-small">
            </div>

            <div class="widget-body">
                <div class="widget-main" id="widgetMain">

                      <!-- canvasjs的生成的chart所处位置 -->
                    <div id="chartContainer"></div>
                </div><!-- /.widget-main -->
            </div><!-- /.widget-body -->
        </div><!-- /.widget-box -->
显示效果:见图片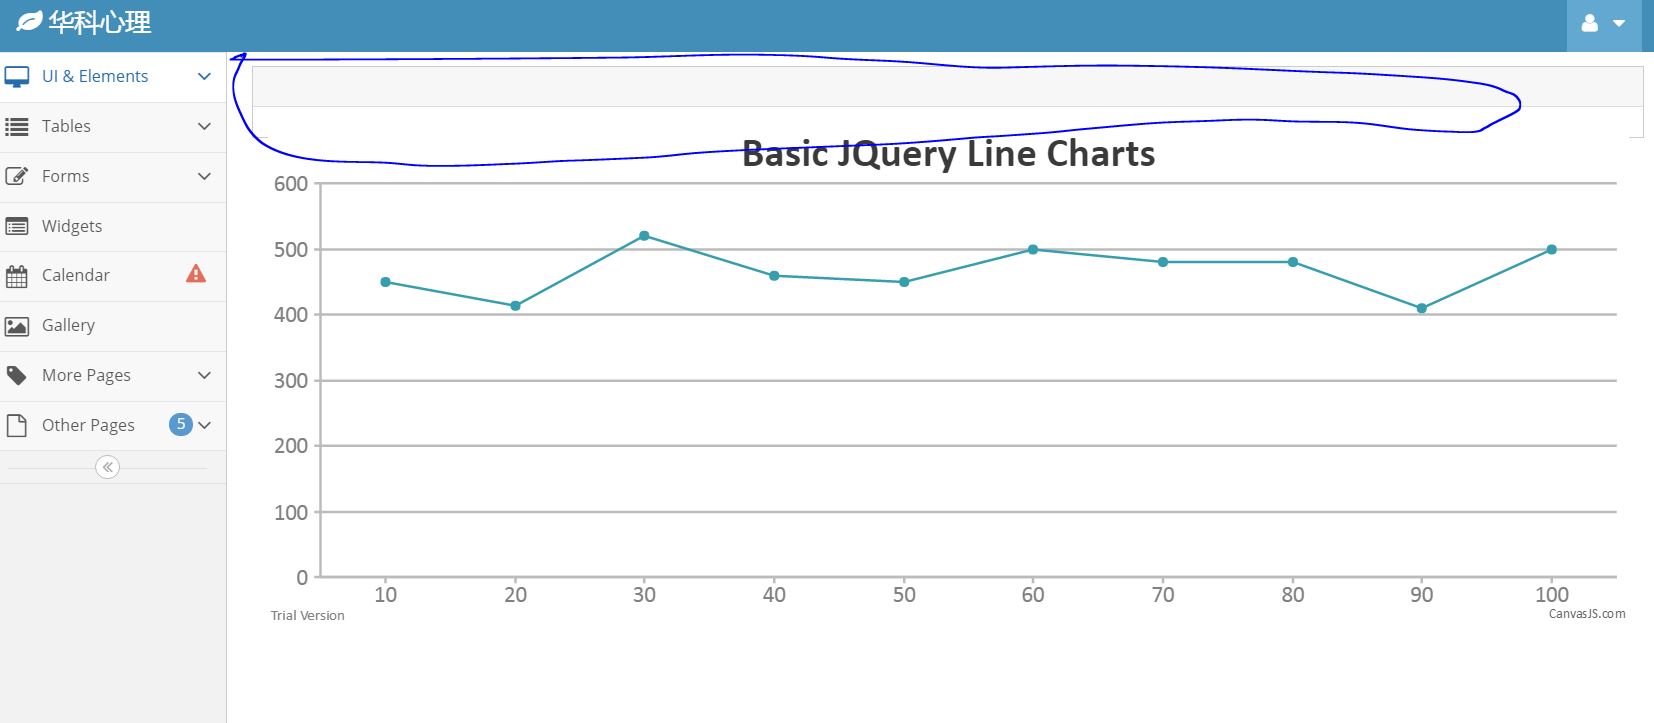
canvasjs:画各种统计图形的JS
canvasjs官网:http://canvasjs.com/javascript-charts/
canvasjs:官网提供的例子(canvasjs的生成的chart直接放在html的body里面)
 <!DOCTYPE HTML>
<html>
<head>
    <script type="text/javascript">
    window.onload = function() {
        var chart = new CanvasJS.Chart("chartContainer", {
            title: {
                text: "Line Chart"
            },
            axisX: {
                interval: 10
            },
            data: [{
                type: "line",
                dataPoints: [
                  { x: 10, y: 45 },
                  { x: 20, y: 14 },
                  { x: 30, y: 20 },
                  { x: 40, y: 60 },
                  { x: 50, y: 50 },
                  { x: 60, y: 80 },
                  { x: 70, y: 40 },
                  { x: 80, y: 60 },
                  { x: 90, y: 10 },
                  { x: 100, y: 50 },
                  { x: 110, y: 40 },
                  { x: 120, y: 14 },
                  { x: 130, y: 70 },
                  { x: 140, y: 40 },
                  { x: 150, y: 90 },
                ]
            }]
        });
        chart.render();
    }
    </script>
    <script src="../../canvasjs.min.js"></script>
    <title>CanvasJS Example</title>
</head>

<body>
    <div id="chartContainer" style="height: 400px; width: 100%;"></div>
</body>

</html>
<div id="chartContainer"></div> 添加高度,你的没有高度,里面的对象应该是float或者absolute定位了导致容器外框没有括起图标
搞定,多谢啦!
         function resizeCanvas() {
             var divChart = document.getElementById('chartContainer');
             if (document.getElementById("trueWidth").offsetWidth > 414)
                divChart.style.width = document.getElementById("trueWidth").offsetWidth * 0.93 + "px";
             else
                divChart.style.width = document.getElementById("trueWidth").offsetWidth * 0.85 + "px";
             divChart.style.height =  $(window).get(0).innerHeight * 0.73 + "px";
             /* alert(" width hight:" + divChart.style.width + "," + divChart.style.height); */

         };