百度echarts官方实例动态数据怎么跑起来?一直粘贴官方代码,就是跑不起来。
option = {
title: {
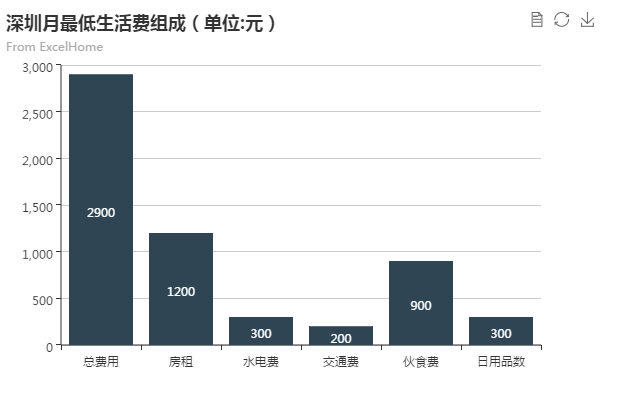
text: '深圳月最低生活费组成(单位:元)',
subtext: 'From ExcelHome',
sublink: 'http://e.weibo.com/1341556070/AjQH99che'
},
tooltip : {
trigger: 'axis',
axisPointer : { // 坐标轴指示器,坐标轴触发有效
type : 'shadow' // 默认为直线,可选为:'line' | 'shadow'
},
formatter: function (params) {
var tar = params[0];
return tar.name + '
' + tar.seriesName + ' : ' + tar.value;
}
},
toolbox: {
show : true,
feature : {
mark : {show: true},
dataView : {show: true, readOnly: false},
restore : {show: true},
saveAsImage : {show: true}
}
},
xAxis : [
{
type : 'category',
splitLine: {show:false},
data : ['总费用','房租','水电费','交通费','伙食费','日用品数']
}
],
yAxis : [
{
type : 'value'
}
],
series : [
{
name:'辅助',
type:'bar',
stack: '总量',
itemStyle:{
normal:{
barBorderColor:'rgba(0,0,0,0)',
color:'rgba(0,0,0,0)'
},
emphasis:{
barBorderColor:'rgba(0,0,0,0)',
color:'rgba(0,0,0,0)'
}
},
data:[0, 1700, 1400, 1200, 300, 0]
},
{
name:'生活费',
type:'bar',
stack: '总量',
itemStyle : { normal: {label : {show: true, position: 'inside'}}},
data:[2900, 1200, 300, 200, 900, 300]
}
]
};
帮你调了一下,可以跑起来的。
你应该是某些格式弄错。使用下面这个吧。
<!DOCTYPE html>
<html>
    <head>
        <meta charset="utf-8"/>
        <!-- import Echarts -->
        <script src="echarts.js"></script>
    </head>

    <body>
        <!-- prepare the Dom for ECharts -->
        <div id="main" style="width: 600px; height:400px;"></div>

        <script type="text/javascript">
            //base on the dom to init the echarts instance
            var myChart = echarts.init(document.getElementById("main"));

            //init the config and data
            /**
            var option = {
                title: {
                    text: 'ECharts Sample'
                },
                tooltip:{},
                legend: {
                    data:['销量']
                },
                xAxis: {
                    data:["衬衫","羊毛衫","雪纺衫","裤子","高跟鞋","袜子"]
                },
                yAxis: {},
                series: [{
                    name:'销量',
                    type:'bar',
                    data:[5,20,36,10,10,20]
                }]
            };
            **/

            var option = {
                title: {
                    text: '深圳月最低生活费组成(单位:元)',
                    subtext: 'From ExcelHome',
                    sublink: 'http://e.weibo.com/1341556070/AjQH99che'
                },
                tooltip : {
                    trigger: 'axis',
                    axisPointer : { // 坐标轴指示器,坐标轴触发有效
                        type : 'shadow' // 默认为直线,可选为:'line' | 'shadow'
                    }
                },
                formatter: function (params) {
                    var tar = params[0];
                    return tar.name + ' ' + tar.seriesName + ' : ' + tar.value;
                },
                toolbox: {
                    show : true,
                    feature : {
                        mark : {show: true},
                        dataView : {show: true, readOnly: false},
                        restore : {show: true},
                        saveAsImage : {show: true}
                    }
                },
                xAxis : {
                    type : 'category',
                    splitLine: {show:false},
                    data : ['总费用','房租','水电费','交通费','伙食费','日用品数']
                },
                yAxis : {
                    type : 'value'
                }

                ,
                series : [
                    {
                        name:'辅助',
                        type:'bar',
                        stack: '总量',
                        itemStyle:{
                            normal:{
                                barBorderColor:'rgba(0,0,0,0)',
                                color:'rgba(0,0,0,0)'
                            },
                            emphasis:{
                                barBorderColor:'rgba(0,0,0,0)',
                                color:'rgba(0,0,0,0)'
                            },
                            data:[0, 1700, 1400, 1200, 300, 0]
                        }
                    },
                    {
                        name:'生活费',
                        type:'bar',
                        stack: '总量',
                        itemStyle : { normal: {label : {show: true, position: 'inside'}}},
                        data:[2900, 1200, 300, 200, 900, 300]
                    }
                ]

            };

            //use the config and data to show the chart
            myChart.setOption(option);

        </script>
    </body>
</html>