echarts3.0 新的图形数据,怎么获取本地图形数据文件
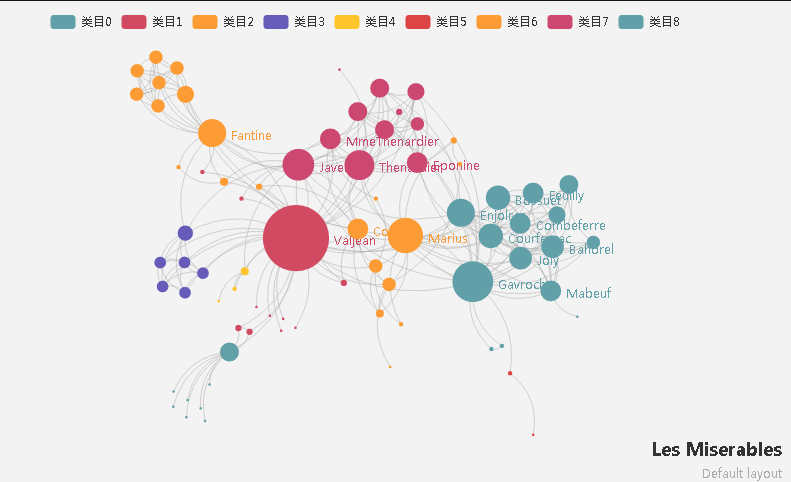
想做一个简单的网页例子,得到如上图的效果
官网API代码:
 myChart.showLoading();
$.get('data/asset/data/les-miserables.gexf', function (xml) {
    myChart.hideLoading();

    var graph = echarts.dataTool.gexf.parse(xml);
    var categories = [];
    for (var i = 0; i < 9; i++) {
        categories[i] = {
            name: '类目' + i
        };
    }
    graph.nodes.forEach(function (node) {
        node.itemStyle = null;
        node.value = node.symbolSize;
        node.label.normal.show = node.symbolSize > 30;
        node.category = node.attributes.modularity_class;
    });
    option = {
        title: {
            text: 'Les Miserables',
            subtext: 'Default layout',
            top: 'bottom',
            left: 'right'
        },
        tooltip: {},
        legend: [{
            // selectedMode: 'single',
            data: categories.map(function (a) {
                return a.name;
            })
        }],
        animationDuration: 1500,
        animationEasingUpdate: 'quinticInOut',
        series : [
            {
                name: 'Les Miserables',
                type: 'graph',
                layout: 'none',
                data: graph.nodes,
                links: graph.links,
                categories: categories,
                roam: true,
                label: {
                    normal: {
                        position: 'right'
                    }
                },
                lineStyle: {
                    normal: {
                        curveness: 0.3
                    }
                }
            }
        ]
    };

    myChart.setOption(option);
}, 'xml');
自己的html代码:
 <!DOCTYPE html>
<html>
<head>
    <meta charset="utf-8">
    <title>ECharts</title>
    <!-- 引入 echarts.js -->
    <script src="echarts.min.js"></script>
    <script src="jquery.js"></script>
</head>
<body>
    <!-- 为ECharts准备一个具备大小(宽高)的Dom -->
    <div id="main" style="width: 600px;height:400px;"></div>
    <script type="text/javascript">
        // 基于准备好的dom,初始化echarts实例
        var myChart = echarts.init(document.getElementById('main'));

        myChart.showLoading();
        $.get('data/asset/data/les-miserables.gexf', function (xml) {
            myChart.hideLoading();

            var graph = echarts.dataTool.gexf.parse(xml);
            var categories = [];
            for (var i = 0; i < 9; i++) {
                categories[i] = {
                    name: '类目' + i
                };
            }
            graph.nodes.forEach(function (node) {
                node.itemStyle = null;
                node.value = node.symbolSize;
                node.label.normal.show = node.symbolSize > 30;
                node.category = node.attributes.modularity_class;
            });
            option = {
                title: {
                    text: 'Les Miserables',
                    subtext: 'Default layout',
                    top: 'bottom',
                    left: 'right'
                },
                tooltip: {},
                legend: [{
                    // selectedMode: 'single',
                    data: categories.map(function (a) {
                        return a.name;
                    })
                }],
                animationDuration: 1500,
                animationEasingUpdate: 'quinticInOut',
                series : [
                    {
                        name: 'Les Miserables',
                        type: 'graph',
                        layout: 'none',
                        data: graph.nodes,
                        links: graph.links,
                        categories: categories,
                        roam: true,
                        label: {
                            normal: {
                                position: 'right'
                            }
                        },
                        lineStyle: {
                            normal: {
                                curveness: 0.3
                            }
                        }
                    }
                ]
            };

            myChart.setOption(option);
        }, 'xml');

    </script>
</body>
</html>
data/asset/data/les-miserables.gexf 文件是我从官网下载
打开的时候报错: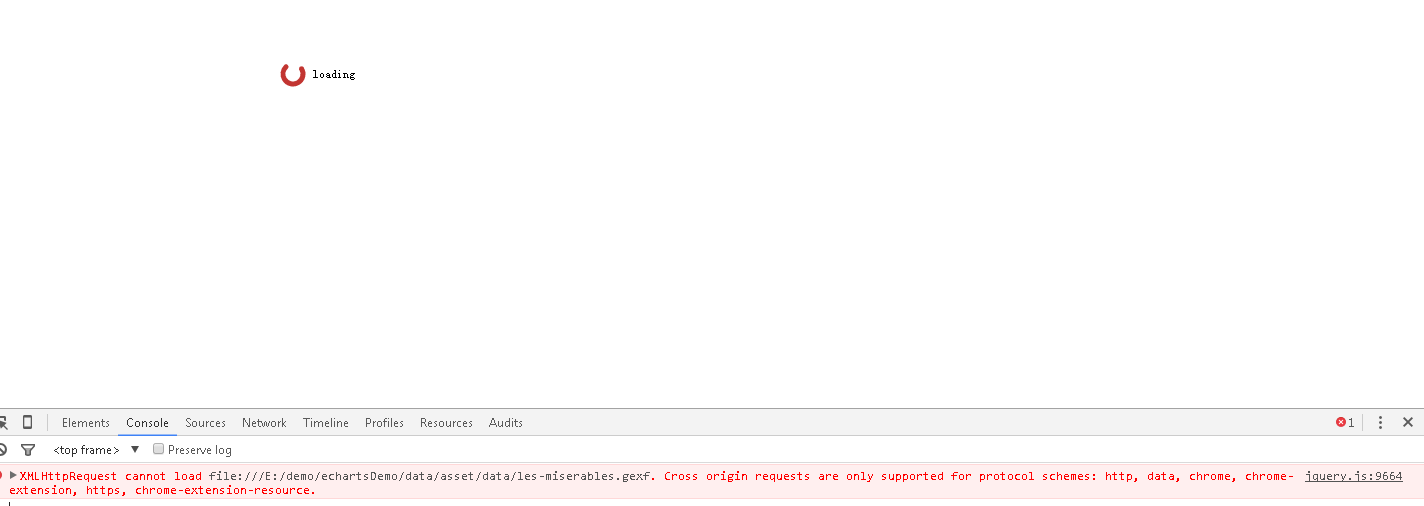
看着是跨域。
在web应用中打开这个html,不要直接桌面点开的方式运行 。
下面有一个 var graph = echarts.dataTool.gexf.parse(xml); 你可能没有dataTool.gexf这个文件我想问问你 你的那个data/asset/data/les-miserables.gexf文件在关望那里下的
data/asset/data/les-miserables.gexf文件在哪里下载的老兄