Echarts折线图区域填充问题
我设置了'itemStyle': {normal: {areaStyle: {type: 'default'}}},后,折线图只是填充到0,请问怎么能在两条折现之间填充颜色?就像要填充在图中所画的位置。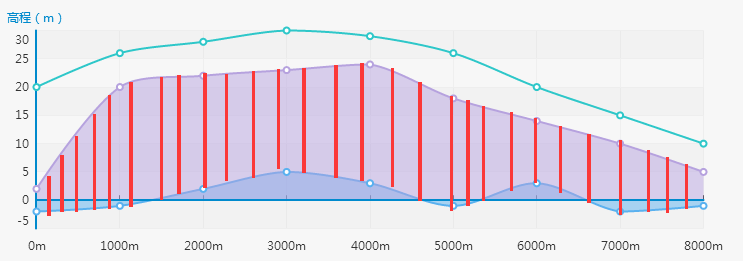
试试看 fillerColor,具体看文档
http://echarts.baidu.com/doc/doc.html
你好同学,效果完成了吗
我设置了'itemStyle': {normal: {areaStyle: {type: 'default'}}},后,折线图只是填充到0,请问怎么能在两条折现之间填充颜色?就像要填充在图中所画的位置。
试试看 fillerColor,具体看文档
http://echarts.baidu.com/doc/doc.html
你好同学,效果完成了吗