js+css实现后台数据返回页面改变页面图片的高度
实现功能:通过websocket实时数据,改变页面图片的高度,做到一个音频的电平跳动效果
有没有大神有类似的demo或者方法提供参考下,的确是有点懵的。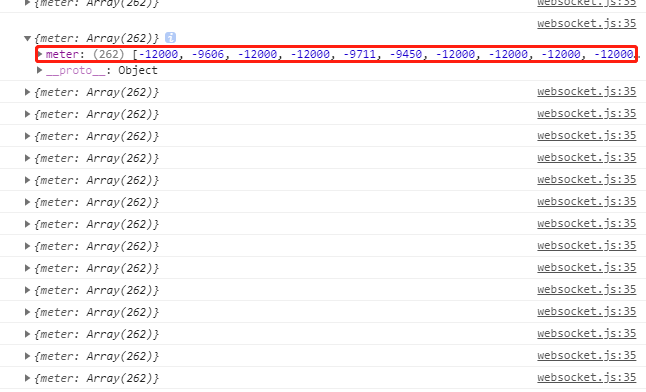
这个就是我页面收到的电平跳动数据,现在想用图片来显示在页面,通过拿到数据调整图片高度来完成电平跳动的效果。有没有大佬有更好的方法。我实在还没弄懂,有没有可以参考的demo,谢谢。
<!DOCTYPE html>
<html>
<head>
    <title></title>
    <style type="text/css">
        .container{
            display: flex;
            flex-direction: row;
            align-items: flex-end;
            height: 200px;
        }
        .item{
            background-image: linear-gradient(red,#0000ff70,#00800057);
            display: flex;
            justify-content: space-between;
            height: 200px;
            width: 100px;
            flex-direction: column;
        }
        .item .first{
            transition: all 100ms
            opacity: 0
        }
        .other{
            background-color: #ffffff;
            transition: all 100ms;
        }
    </style>
</head>
<body>
    <div class="container">
        <div class="item">
            <div class="other"></div>
            <div id="div1" class=" first"></div>
        </div>
        <div class="item">
            <div class="other"></div>
            <div id="div2" class=" first"></div>

        </div>
        <div class="item">
            <div class="other"></div>
            <div id="div3" class=" first"></div>
        </div>
        <div class="item">
            <div class="other"></div>
            <div id="div4" class=" first"></div>
        </div>
        <div class="item">
            <div class="other"></div>
            <div id="div5" class=" first"></div>
        </div>
    </div>

<script type="text/javascript">
    setInterval(function () {
        for (var i = 5; i > 0; i--) {
            var hello = document.getElementById('div' + i);
            hello.style.height = parseInt( Math.random() * 200) + 'px'
            parent = hello.parentNode;
            parent.getElementsByClassName('other')[0].style.height = (200 - parseInt( Math.random() * 200)) + 'px'
        }
    }, 100)

    // ws接收并解析数据
    // ws.onmessage = function(msg) {
    //  // 解析msg
    //  // 解析出来的数据按一定比例设置为div高度
    // }

</script>
</body>
</html>
如果用echarts,你可以看看这个例子
https://echarts.apache.org/examples/zh/editor.html?c=dynamic-data
把代码底部的部分代码注释掉(以//开头),会更好理解些
app.count = 11;
setInterval(function (){
    var axisData = (new Date()).toLocaleTimeString().replace(/^\D*/, '');

    var data0 = option.series[0].data;
    var data1 = option.series[1].data;
    data0.shift();
    data0.push(Math.round(Math.random() * 1000));
    data1.shift();
    data1.push((Math.random() * 10 + 5).toFixed(1) - 0);

    //option.xAxis[0].data.shift();
    //option.xAxis[0].data.push(axisData);
    //option.xAxis[1].data.shift();
    //option.xAxis[1].data.push(app.count++);

    myChart.setOption(option);
}, 2100);
<!DOCTYPE html>
<html lang="en">

<head>
  <meta charset="UTF-8">
  <meta name="viewport" content="width=device-width, initial-scale=1.0">
  <meta http-equiv="X-UA-Compatible" content="ie=edge">
  <title>HTML5音频可视化频谱跳动代码</title>
  <style>
    * {
      margin: 0;
      padding: 0;
    }

    #canvas {
      display: block;
      background: linear-gradient(135deg, rgb(142, 13, 133) 0%, rgb(230, 132, 110) 100%);
    }
  </style>
</head>

<body>
  <audio id="myaudio" src="./mp3.mp3"></audio>
  <canvas id="canvas"></canvas>
  <script>
    window.onload = function () {
      var oAudio = document.getElementById('myaudio');
      window.onclick = function () {
        if (oAudio.paused) {
          oAudio.play();
        } else {
          oAudio.pause();
        }
      }
      // 创建音频上下文对象
      var oCtx = new AudioContext();
      // console.log(oCtx);
      // 创建媒体源,除了audio本身可以获取,也可以通过oCtx对象提供的api进行媒体源操作
      var audioSrc = oCtx.createMediaElementSource(oAudio);
      // 创建分析机
      var analyser = oCtx.createAnalyser();
      // 媒体源与分析机连接
      audioSrc.connect(analyser);
      // 输出的目标:将分析机分析出来的处理结果与目标点(耳机/扬声器)连接
      analyser.connect(oCtx.destination);

      // 效果(实现的具体方法)
      // 绘制音频图的条数(fftSize)
      /*
        根据分析音频的数据去获取音频频次界定音频图的高度
        放在与音频频次等长的8位无符号字节数组
        Uint8Array:初始化默认值为1024
      */
      // 利用cancas渐变进行音频绘制
      var ctx = canvas.getContext('2d');
      canvas.width = window.innerWidth;
      canvas.height = window.innerHeight;
      var oW = canvas.width;
      var oH = canvas.height;
      var color1 = ctx.createLinearGradient(oW / 2, oH / 2 - 30, oW / 2, oH / 2 - 100);
      var color2 = ctx.createLinearGradient(oW / 2, oH / 2 + 30, oW / 2, oH / 2 + 100);
      color1.addColorStop(0, '#000');
      color1.addColorStop(.5, '#069');
      color1.addColorStop(1, '#f6f');
      color2.addColorStop(0, '#000');
      color2.addColorStop(.5, '#069');
      color2.addColorStop(1, '#f6f');
      // 音频图的条数
      var count = 150;
      // 缓冲区:进行数据的缓冲处理,转换成二进制数据
      var voiceHeight = new Uint8Array(analyser.frequencyBinCount);
      // console.log(voiceHeight);

      function draw() {
        // 将当前的频率数据复制到传入的无符号字节数组中,做到实时连接
        analyser.getByteFrequencyData(voiceHeight);
        // console.log(voiceHeight);
        // 自定义获取数组里边数据的频步
        var step = Math.round(voiceHeight.length / count);
        ctx.clearRect(0, 0, oW, oH);
        for (var i = 0; i < count; i++) {
          var audioHeight = voiceHeight[step * i];
          ctx.fillStyle = color1;  // 绘制向上的线条
          ctx.fillRect(oW / 2 + (i * 10), oH / 2, 7, -audioHeight);
          ctx.fillRect(oW / 2 - (i * 10), oH / 2, 7, -audioHeight);
          ctx.fillStyle = color2;  // 绘制向下的线条
          ctx.fillRect(oW / 2 + (i * 10), oH / 2, 7, audioHeight);
          ctx.fillRect(oW / 2 - (i * 10), oH / 2, 7, audioHeight);
        }
        window.requestAnimationFrame(draw);
      }
      draw();


      /*
        analyserNode 提供了时时频率以及时间域的分析信息
            允许你获取实时的数据,并进行音频可视化
            analyserNode接口的fftSize属性
                fftSize:无符号长整型值,用于确定频域的FFT(快速傅里叶变换)
                ffiSize属性值是从32位到32768范围内的2的非零幂,默认值是2048
      */
    }
  </script>
</body>

</html>