MPAndroidChart刷新图表不变
用MPAndroidChart建了一个折线图,但是刷新不了图表
在按钮点击触发器中我有加
chart1.notifyDataSetChanged();
和
chart1.invalidate();
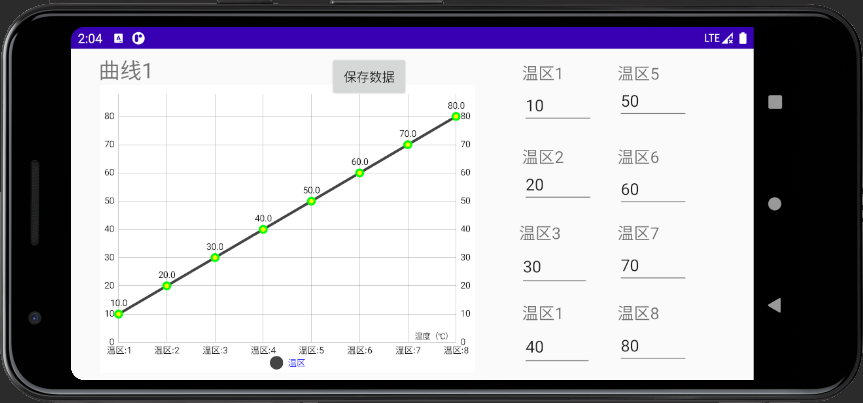
并且为了看数据有没有变化我还特地直接让temp1直接等于20并显示出来,显示出来temp1是有变化的,但是图表并没有变化
见图片:
点击按钮前:
点击按钮后:

见代码:
package com.example.myapplication2;

import android.app.Activity;
import android.content.pm.ActivityInfo;
import android.graphics.Color;
import android.os.Bundle;
import android.text.Editable;
import android.text.TextWatcher;
import android.view.View;
import android.widget.Button;
import android.widget.EditText;
import android.widget.TextView;


import com.github.mikephil.charting.charts.*;
import com.github.mikephil.charting.components.Legend;
import com.github.mikephil.charting.components.XAxis;
import com.github.mikephil.charting.data.*;
import com.github.mikephil.charting.formatter.ValueFormatter;
import com.github.mikephil.charting.utils.ViewPortHandler;

import java.util.ArrayList;

public class SecondActivity extends Activity {
    TextView textView3;
    int temp1=10,temp2=20,temp3=30,temp4=40,temp5=50,temp6=60,temp7=70,temp8=80;
    TextView temperature1,temperature2,temperature3,temperature4,temperature5,temperature6,temperature7,temperature8;
    EditText edittemp1,edittemp2,edittemp3,edittemp4,edittemp5,edittemp6,edittemp7,edittemp8;
    Button button;
    LineChart chart1;

    @Override
    public void onCreate(Bundle saveInstanceState){
        super.onCreate(saveInstanceState);
        setContentView(R.layout.activity_second);
        textView3=(TextView)findViewById(R.id.textView3);
        button=(Button)findViewById(R.id.button);
        temperature1=(TextView)findViewById(R.id.temperature1);
        temperature2=(TextView)findViewById(R.id.temperature2);
        temperature3=(TextView)findViewById(R.id.temperature3);
        temperature4=(TextView)findViewById(R.id.temperature4);
        temperature5=(TextView)findViewById(R.id.temperature5);
        temperature6=(TextView)findViewById(R.id.temperature6);
        temperature7=(TextView)findViewById(R.id.temperature7);
        temperature8=(TextView)findViewById(R.id.temperature8);
        edittemp1=(EditText)findViewById(R.id.edittemp1);
        edittemp2=(EditText)findViewById(R.id.edittemp2);
        edittemp3=(EditText)findViewById(R.id.edittemp3);
        edittemp4=(EditText)findViewById(R.id.edittemp4);
        edittemp5=(EditText)findViewById(R.id.edittemp5);
        edittemp6=(EditText)findViewById(R.id.edittemp6);
        edittemp7=(EditText)findViewById(R.id.edittemp7);
        edittemp8=(EditText)findViewById(R.id.edittemp8);
        setRequestedOrientation(ActivityInfo.SCREEN_ORIENTATION_LANDSCAPE);
        chart1 = (LineChart) findViewById(R.id.chart1);

        // 制作8个数据点(沿x坐标轴)
        LineData mLineData = makeLineData(8);
        setChartStyle(chart1, mLineData, Color.WHITE);
        button.setOnClickListener(new View.OnClickListener() {
            @Override
            public void onClick(View view) {
                String str1=edittemp1.getText().toString();
                if(str1.length()!=0)
                    temp1=Integer.parseInt(str1);
                String str2=edittemp2.getText().toString();
                if(str2.length()!=0)
                    temp2=Integer.parseInt(str2);
                String str3=edittemp3.getText().toString();
                if(str3.length()!=0)
                    temp3=Integer.parseInt(str3);
                String str4=edittemp4.getText().toString();
                if(str4.length()!=0)
                    temp4=Integer.parseInt(str4);
                String str5=edittemp5.getText().toString();
                if(str5.length()!=0)
                    temp5=Integer.parseInt(str5);
                String str6=edittemp6.getText().toString();
                if(str6.length()!=0)
                    temp6=Integer.parseInt(str6);
                String str7=edittemp7.getText().toString();
                if(str7.length()!=0)
                    temp7=Integer.parseInt(str7);
                String str8=edittemp8.getText().toString();
                if(str8.length()!=0)
                    temp8=Integer.parseInt(str8);

                temp1=20;
                edittemp1.setText(""+temp1);

                chart1.notifyDataSetChanged(); // let the chart know it's data changed
                chart1.invalidate(); // refresh
            }
        });

    }

    // 设置chart显示的样式
    private void setChartStyle(LineChart mLineChart, LineData lineData,
                               int color) {
        // 是否在折线图上添加边框
        mLineChart.setDrawBorders(false);

        mLineChart.setDescription("温度(℃)");// 数据描述

        // 如果没有数据的时候,会显示这个,类似listview的emtpyview
        mLineChart.setNoDataTextDescription("如果传给MPAndroidChart的数据为空,那么你将看到这段文字。@Zhang Phil");

        // 是否绘制背景颜色。
        // 如果mLineChart.setDrawGridBackground(false),
        // 那么mLineChart.setGridBackgroundColor(Color.CYAN)将失效;
        mLineChart.setDrawGridBackground(false);
        mLineChart.setGridBackgroundColor(Color.CYAN);

        // 触摸
        mLineChart.setTouchEnabled(true);

        // 拖拽
        //mLineChart.setDragEnabled(true);

        // 缩放
        //mLineChart.setScaleEnabled(true);

        mLineChart.setPinchZoom(false);
        // 隐藏右边 的坐标轴
        mLineChart.getAxisRight().setEnabled(false);
        // 让x轴在下面

        mLineChart.getXAxis().setPosition(XAxis.XAxisPosition.BOTTOM);

        // // 隐藏左边坐标轴横网格线
        // mLineChart.getAxisLeft().setDrawGridLines(false);
        // // 隐藏右边坐标轴横网格线
        // mLineChart.getAxisRight().setDrawGridLines(false);
        // // 隐藏X轴竖网格线
        // mLineChart.getXAxis().setDrawGridLines(false);
        mLineChart.getAxisRight().setEnabled(true); // 隐藏右边 的坐标轴(true不隐藏)
        mLineChart.getXAxis().setPosition(XAxis.XAxisPosition.BOTTOM); // 让x轴在下面
        // 设置背景
        mLineChart.setBackgroundColor(color);

        // 设置x,y轴的数据
        mLineChart.setData(lineData);

        // 设置比例图标示,就是那个一组y的value的
        Legend mLegend = mLineChart.getLegend();

        mLegend.setPosition(Legend.LegendPosition.BELOW_CHART_CENTER);
        mLegend.setForm(Legend.LegendForm.CIRCLE);// 样式
        mLegend.setFormSize(15.0f);// 字体
        mLegend.setTextColor(Color.BLUE);// 颜色

        // 沿x轴动画,时间2000毫秒。
        mLineChart.animateX(2000);
    }

    /**
     * @param count 数据点的数量。
     * @return
     */
    private LineData makeLineData(int count) {
        ArrayList<String> x = new ArrayList<String>();
        for (int i = 0; i < count; i++) {
            // x轴显示的数据
            x.add("温区:" + (i+1));
        }

        // y轴的数据
        ArrayList<Entry> y = new ArrayList<Entry>();
        float val1=(float)temp1;
        Entry entry1 =new Entry(val1,0);
        y.add(entry1);
        float val2=(float)temp2;
        Entry entry2 =new Entry(val2,1);
        y.add(entry2);
        float val3=(float)temp3;
        Entry entry3 =new Entry(val3,2);
        y.add(entry3);
        float val4=(float)temp4;
        Entry entry4 =new Entry(val4,3);
        y.add(entry4);
        float val5=(float)temp5;
        Entry entry5 =new Entry(val5,4);
        y.add(entry5);
        float val6=(float)temp6;
        Entry entry6 =new Entry(val6,5);
        y.add(entry6);
        float val7=(float)temp7;
        Entry entry7 =new Entry(val7,6);
        y.add(entry7);
        float val8=(float)temp8;
        Entry entry8 =new Entry(val8,7);
        y.add(entry8);

//        for (int i = 0; i < count; i++) {
//            float val = (float) (Math.random() * 100);
//            Entry entry = new Entry(val, i);
 //           y.add(entry);
//        }

        // y轴数据集
        LineDataSet mLineDataSet = new LineDataSet(y, "温区");

        // 用y轴的集合来设置参数
        // 线宽
        mLineDataSet.setLineWidth(3.0f);

        // 显示的圆形大小
        mLineDataSet.setCircleSize(5.0f);

        // 折线的颜色
        mLineDataSet.setColor(Color.DKGRAY);

        // 圆球的颜色
        mLineDataSet.setCircleColor(Color.GREEN);

        // 设置mLineDataSet.setDrawHighlightIndicators(false)后,
        // Highlight的十字交叉的纵横线将不会显示,
        // 同时,mLineDataSet.setHighLightColor(Color.CYAN)失效。
        mLineDataSet.setDrawHighlightIndicators(true);

        // 按击后,十字交叉线的颜色
        mLineDataSet.setHighLightColor(Color.CYAN);

        // 设置这项上显示的数据点的字体大小。
        mLineDataSet.setValueTextSize(10.0f);

        // mLineDataSet.setDrawCircleHole(true);

        // 改变折线样式,用曲线。
        // mLineDataSet.setDrawCubic(true);
        // 默认是直线
        // 曲线的平滑度,值越大越平滑。
        // mLineDataSet.setCubicIntensity(0.2f);

        // 填充曲线下方的区域,红色,半透明。
        // mLineDataSet.setDrawFilled(true);
        // mLineDataSet.setFillAlpha(128);
        // mLineDataSet.setFillColor(Color.RED);

        // 填充折线上数据点、圆球里面包裹的中心空白处的颜色。
        mLineDataSet.setCircleColorHole(Color.YELLOW);

        // 设置折线上显示数据的格式。如果不设置,将默认显示float数据格式。
 /*       mLineDataSet.setValueFormatter(new ValueFormatter() {

//          @Override
//          public String getFormattedValue(float value) {
//              int n = (int) value;
//              String s = "y:" + n;
//              return s;
//          }

            @Override
            public String getFormattedValue(float value, Entry entry,
                                            int dataSetIndex, ViewPortHandler viewPortHandler) {
                // TODO Auto-generated method stub
                int n = (int) value;
                String s = "y:" + n;
                return s;
            }
        });*/

        ArrayList<LineDataSet> mLineDataSets = new ArrayList<LineDataSet>();
        mLineDataSets.add(mLineDataSet);

        LineData mLineData = new LineData(x, mLineDataSets);

        return mLineData;
    }
}
https://blog.csdn.net/zhangphil/article/details/50185115?locationNum=3