在使用R语言的ggplot2包绘制折线图时,遇到一个问题,就是当折线太多(我目前要绘制70多组数据的折线),使用线形区分,线形种类不够,使用颜色区分,很多相近的颜色不好分辨,所以考虑到不使用图例,而是在每条折线末端添加标签,注明折线代表哪一组数据。但是使用图层geom__text好像只能给折线上的点添加标签,而不能给整条线添加标签,所以想问一下该怎样给每条折线末端添加一个标签。这是我绘图的代码:
ggplot(plot_data,aes(x = date,y = confirmed,colour = country,group = country)) + geom_line() + theme( plot.margin = unit(c(0,0,0,0), "cm")) + coord_cartesian(ylim=c(1000, 1800000)) + geom_text(aes(label = paste0(country)),check_overlap = T)
```其中plot_data、data、confirmed、country都是绘图所需要的数据。
最后希望得到这样类似的效果: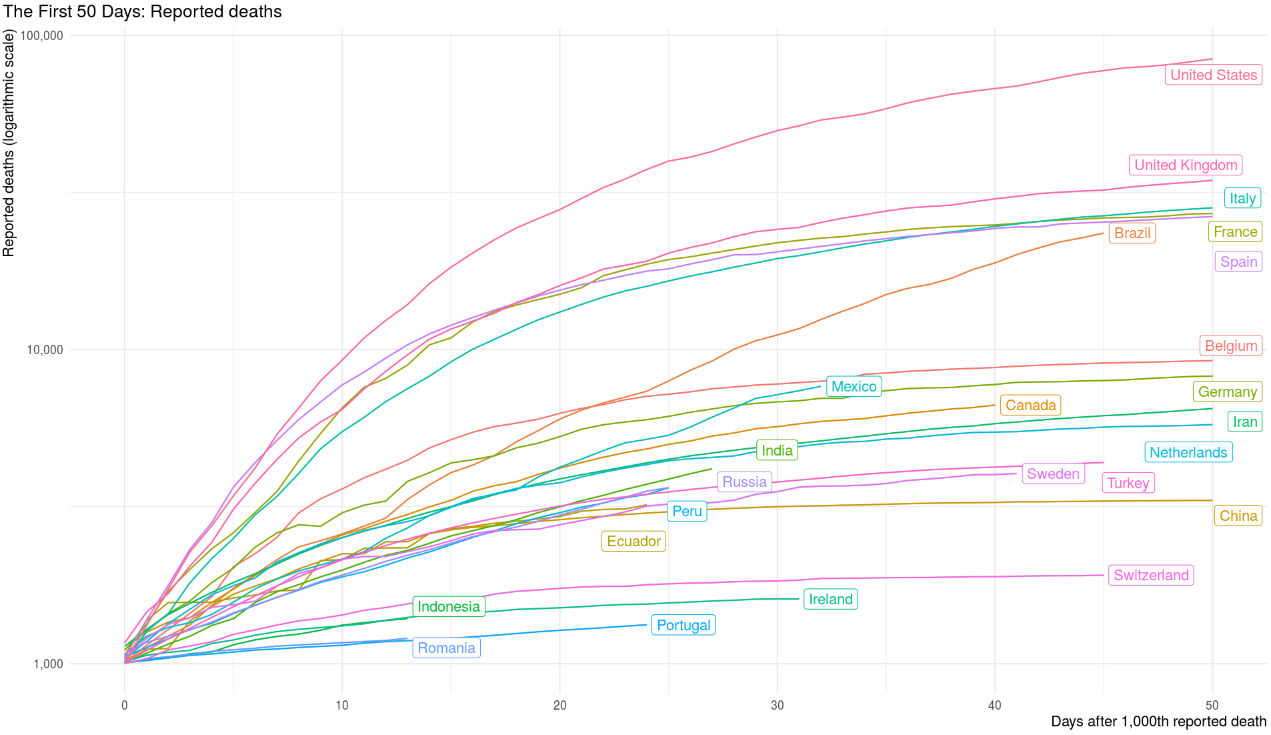
感谢!
以country分组为不同颜色绘制的折线图不是应该已经有国家名的legend图例显示了吗?
可以使用ggrepel包中的geom_label_repel函数
```r
ggplot(plot_data, aes(x, y, col = country)) +    # Draw ggplot2 plot with labels
  geom_line() +
  geom_label_repel(aes(label = country),
                   nudge_x = 1,
                   na.rm = TRUE) +
  theme(legend.position = "none")#隐藏图例
```