小程序利用ec-chart输出折线图,series里的data如何赋值
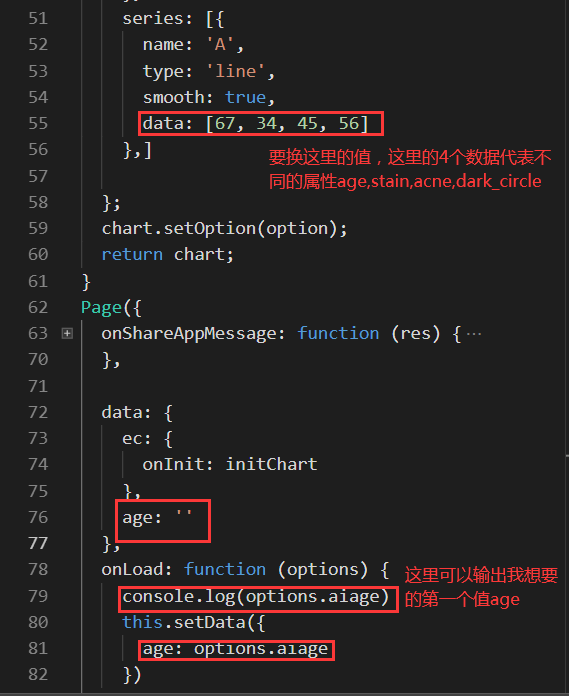
怎么使options.aiage的值给到series里的data里面???
拜托拜托,大神给看看吧!!!
p.s:我怀疑是series所在的折线图代码不在page({ })里面所以值不能传递,但是折线图代码放到page或者page里面的onload里面就会报错,是不是折线图代码格式有问题,下面是我的折线图代码?
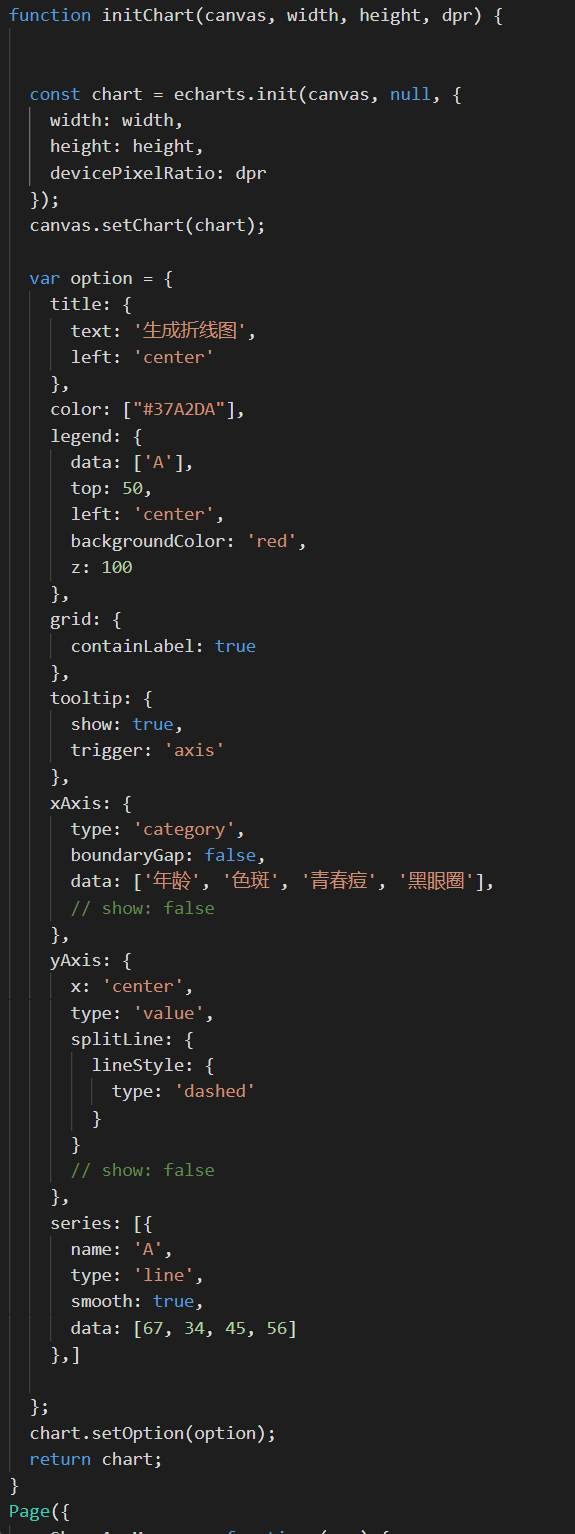
当折线图代码放到onload里面的时候就会报错:Uncaught ReferenceError: initChart is not defined
救救孩子吧!!
function init() {
        $.ajax({
            cache : true,
            type : "POST",
            url : prefix + "/getData",
            async : false,
            cache : false,
            processData : false,
            contentType : false,
            dataType : "json",
            error : function(request) {
                $.modal.alertError("系统错误");
            },
            success : function(data) {
                var treeChart = echarts.init(document
                        .getElementById("echarts-tree-chart"),null, {devicePixelRatio: 2});
                initTree(treeChart, data);
            }
        });
    }

    function initTree(treeChart, json, d) {
        var dd = [ json ];
        if (d != undefined) {
            dd = d;
        }
        treeoption = {

            tooltip : {
                trigger : 'item',
                triggerOn : 'mousemove',
                //show:false,

                //formatter: '{c}',// 对应数据中的value值
                formatter : function(param) {
                    var value = '出生日期:'
                            + getDateStr(param.data.data.personBirthDate)
                            + '</br>出生地:'
                            + getStr(param.data.data.personBirthPlace)
                            + '</br>备注:'
                            + cutStr(param.data.data.personRemark, 50);//自定义字段名
                    return value;
                }
            },
            series : [ {
                type : 'tree',
                roam : 'true',
                data : dd,
                initialTreeDepth : 100,
                left : '2%',
                right : '2%',
                top : '8%',
                bottom : '20%',
                //clickable:false,
                symbol : 'diamond',
                //symbol:'circle',
                //symbol:'image://'+apppath+'/img/user.png',
                symbolSize : 20,
                orient : 'vertical',

                expandAndCollapse : true,

                label : {
                    normal : {
                        position : 'top',
                        rotate : 0,
                        verticalAlign : 'middle',
                        align : 'center',
                        fontSize : 20,
                        distance :10,
                    },

                },

                leaves : {
                    label : {
                        normal : {
                            position : 'bottom',
                            rotate : 0,
                            verticalAlign : 'middle',
                            align : 'left'
                        }
                    }
                },

                animationDurationUpdate : 750
            } ]
        };
        treeChart.setOption(treeoption);
        $(window).resize(treeChart.resize);
        //屏蔽默认右键(图片另存)
        document.oncontextmenu = function(e) {
            return false;
        }
    }