为什么这里添加均值和errorbar的位置不对呢?
我是用ggplot2做的箱线图,但是在插入均值和误差线的时候就出现了下图这种情况:
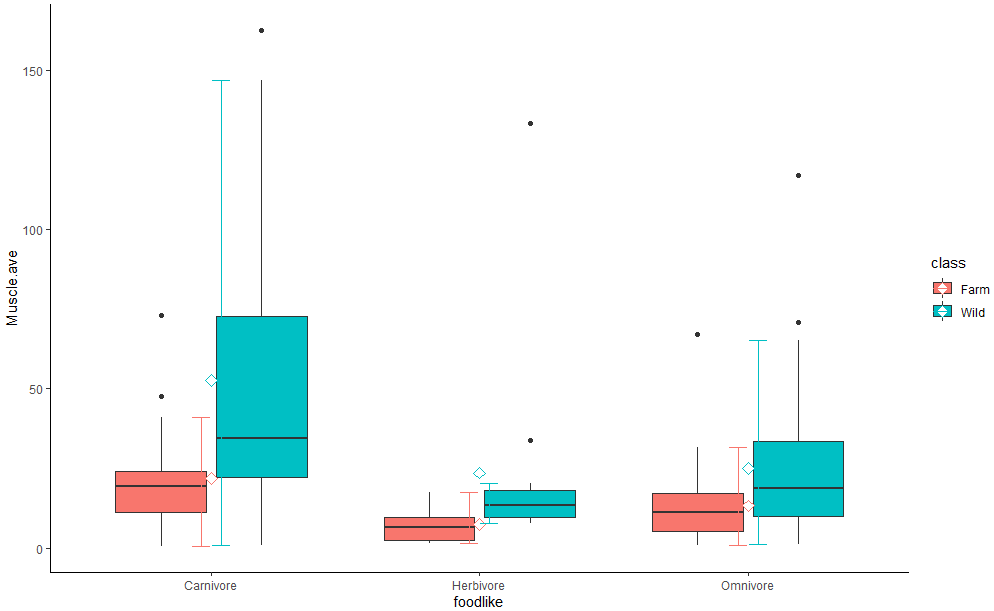
对应的代码长这样:
install.packages("ggplot2")
library(ggplot2)
c<-read.table(file = "foodlike.txt",header = T)
# 作图
cp<-ggplot(data = c,aes(x=foodlike,y=Muscle.ave,fill=class))+geom_boxplot()+theme_classic() +
  stat_summary(fun = 'mean', geom = 'point',shape = 23,size = 3,fill = 'white',aes(color = class)) +
  stat_boxplot(geom = 'errorbar',width = 0.15, aes(color = class))
cp
求大佬指点!谢谢!
我也遇到了这个问题,请问你解决了吗
加上geom_boxplot(size=0.5,position=position_dodge(.9))和在stat_summary(fun = "mean", geom = "point",aes(group=group), position=position_dodge(.9))