卷积特征图可视化问题
为什么我的特征图输出完全看不出原图的样子,感觉不对呀(用的pytorch)
我是在在前向传播里定义的特征图
self.result = self.conv1(x)
用自己建立的网络测试一张图片分类和特征图可视化部分代码如下
net.eval()
        ship = cv2.imread('horse.png')  # read a image
        ship = cv2.cvtColor(ship, cv2.COLOR_BGR2RGB)

        # reshape it to 3*32*32
        ship = cv2.resize(ship, (32, 32))
        image = ship.reshape(-1, 3, 32, 32)

        # convert to torch tensor
        image_tensor = torch.from_numpy(image).float()

        net.eval()
        net.load_state_dict(torch.load("./model/net.pt"))  # Call the model for evaluation

        output = net(image_tensor)
        _, predicted = torch.max(output.data, 1)
        pre = predicted.cpu().numpy()
        # print(pre)  # show prediction class index
        print(classes[pre[0]])  # print prediction label

        features = net.result
        print(features.shape)

        for i in range(features.shape[1]):
            feature = features[0, i, :, :]  # 在channel维度上,每个channel代表了一个卷积核的输出特征图,所以对每个channel的图像分别进行处理和保存

            feature = feature.view(feature.shape[0], feature.shape[1])  # batch为1,所以可以直接view成二维张量

            feature = feature.data.numpy()  # 转为numpy

            # 根据图像的像素值中最大最小值,将特征图的像素值归一化到了[0,1];
            feature = (feature - np.amin(feature)) / (np.amax(feature) - np.amin(feature) + 1e-5)  # 注意要防止分母为0!
            feature = np.round(feature * 255)  # [0, 1]——[0, 255],为cv2.imwrite()函数而进行

            plt.subplot(6, 6, i + 1)
            plt.imshow(feature, cmap='gray')
            plt.axis('off')
        plt.savefig('./CONV_rslt.png')
        plt.show()
求教到底是什么原因导致我特征图输出结果出现了问题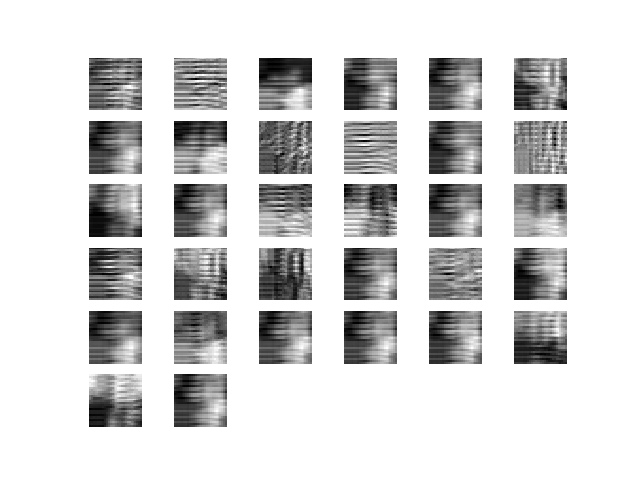
检查网络结构是否适合任务,并根据需要进行调整。
调整输入图像的预处理,例如尝试不同的缩放和调整大小方法,并确保不会损失重要特征。
调整特征图的规范化方法,例如试试其他规范化方法,如局部响应归一化或批次归一化。
尝试不同的可视化方法,例如使用颜色映射或叠加特征图和原始图像。